

The S&P 500 Index is universally recognized as the premier benchmark for the U.S. stock market. It tracks the performance of 500 leading publicly traded companies and represents the backbone of global equity investing. More than just a number, it serves as a vital pulse check on corporate America and the broader economy.
This comprehensive guide explains what the S&P 500 is, explores its historical evolution, details how it is constructed, analyzes its sector composition and performance, and provides learnings investment strategies. Designed for both beginners and intermediate investors, this article delivers clarity, depth, and practical insight.
What Is the S&P 500 Index?
The S&P 500 (Standard & Poor’s 500) is a stock market index that measures the performance of 500 large-cap U.S. companies across multiple industries. It is not merely a list but a carefully curated barometer designed to reflect the risk and return characteristics of the large-cap segment of the U.S. equity universe.
- Represents approximately 80% of total U.S. equity market capitalization, offering unparalleled market coverage.
- Employs a market-cap weighted and free-float adjusted methodology, ensuring its movement accurately mirrors the economic significance of its constituents.
- Widely considered a proxy for the U.S. economy and a key benchmark for investment portfolio performance.
The Evolution and History of the S&P 500
To fully appreciate the S&P 500’s authority, one must understand its journey. While today it is the definitive barometer of American business, its history reflects the dynamic evolution of the U.S. economy itself.
Its predecessor, the S&P 90, launched in the 1920s. The modern S&P 500 index, as we know it, was officially introduced on March 4, 1957, by Standard & Poor’s. This was a revolutionary step, as it was one of the first indices to be published in real-time via a computerized system.
The index’s composition and role have transformed through key economic eras:
- The “Nifty Fifty” Era (1960s-70s): Dominated by large industrial and consumer staple companies perceived as unshakeable “buy-and-hold-forever” stocks.
- The Tech Boom & Rebalancing (1990s-2000s): The dot-com bubble saw technology stocks soar in weight. The subsequent crash led to a greater emphasis on diversification and stricter financial viability criteria for inclusion.
- The Financial Crisis (2008): The collapse of major index components like Lehman Brothers underscored the index’s deep entanglement with the broader economy, prompting significant sector re-weighting and regulatory scrutiny.
- The Rise of Mega-Cap Tech (2010s-Present): Companies like Apple, Microsoft, and Nvidia have come to dominate, driving performance but also leading to increased concentration. A critical modern observation is that the top 10 companies now constitute over 30% of the entire index’s weight, highlighting the profound implications of its market-cap weighting.
This historical journey from an industrial-focused gauge to a technology-driven benchmark is essential for understanding its current structure, sensitivities, and future trajectory.
How the S&P 500 Is Calculated and Maintained
The integrity of the S&P 500 stems from its rigorous methodology. It uses a market capitalization-weighted system, meaning companies with larger market values exert a greater influence on index movements. A committee at S&P Dow Jones Indices maintains it based on publicly available criteria:
- Market Capitalization & Liquidity: A minimum market cap (currently ~$15.8 billion) and sufficient trading volume are required.
- Public Float Availability: Only shares readily available for public trading are counted, excluding closely held shares.
- Financial Viability: Companies must demonstrate positive earnings in the most recent quarter and over the trailing four quarters combined.
- U.S. Domicile: Headquarters must be in the United States, though global revenue is common.
- Sector Representation: The committee aims for an index that is representative of the broader U.S. equity market’s sectors.
S&P 500 Sector Composition
The S&P 500 is diversified across 11 major economic sectors as defined by the Global Industry Classification Standard (GICS). This diversification is a key feature, though the weight of each sector shifts with market tides.
The following visualization illustrates the distribution of companies across these sectors, highlighting the industrial and financial sectors’ numerical dominance.
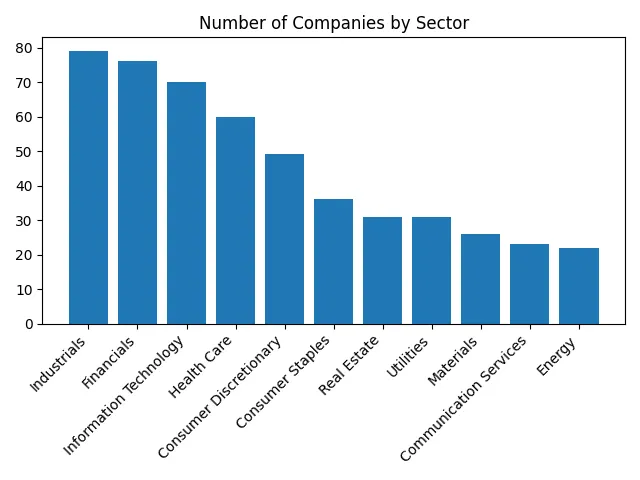
However, the number of companies doesn’t tell the full story of influence. The pie chart below reveals the percentage weight each sector holds within the index, which is directly tied to the collective market capitalization of its constituents. This shows the outsized impact of sectors like Information Technology.
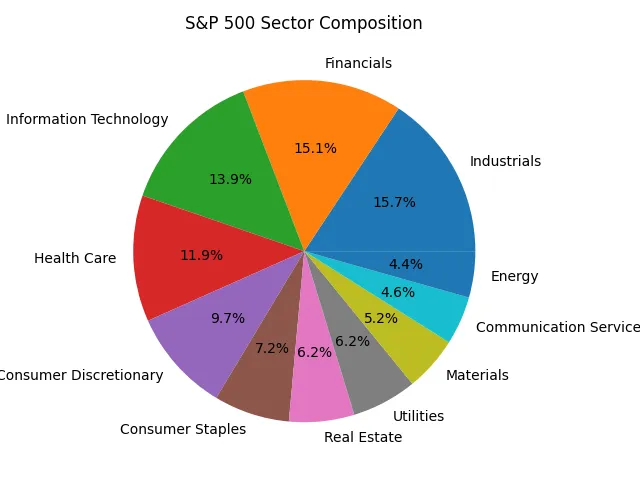
S&P 500 Sector Breakdown (Company Count)
| Sector | Companies | % of Index |
|---|---|---|
| Industrials | 79 | 15.71% |
| Financials | 76 | 15.11% |
| Information Technology | 70 | 13.92% |
| Health Care | 60 | 11.93% |
| Consumer Discretionary | 49 | 9.74% |
| Consumer Staples | 36 | 7.16% |
| Real Estate | 31 | 6.16% |
| Utilities | 31 | 6.16% |
| Materials | 26 | 5.17% |
| Communication Services | 23 | 4.57% |
| Energy | 22 | 4.37% |
S&P 500 Sector Performance Overview
Sector performance is rarely uniform. Economic cycles, interest rates, and technological disruption cause significant divergence. The following chart compares the average one-year price return across all 11 sectors, revealing clear leaders and laggards in the recent period.
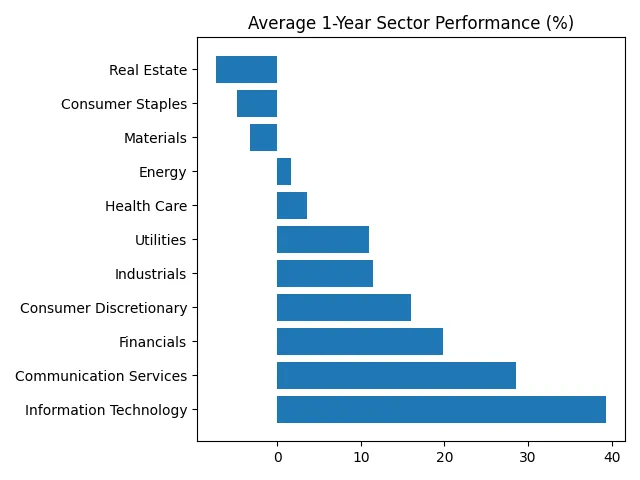
S&P Average 1-Year Sector Returns(2025)
| Sector | Avg Return (%) |
|---|---|
| Information Technology | 39.26% |
| Communication Services | 28.50% |
| Financials | 19.85% |
| Consumer Discretionary | 16.05% |
| Industrials | 11.45% |
| Utilities | 10.98% |
| Health Care | 3.60% |
| Energy | 1.69% |
| Materials | -3.26% |
| Consumer Staples | -4.78% |
| Real Estate | -7.27% |
For a deeper analysis of corporate profitability, see our dedicated S&P 500 earnings anatomy study.
Sub-Industry Diversification Within the Index
Diving deeper than sectors reveals the true granularity of the index. Each sector comprises numerous sub-industries, allowing for targeted exposure to specific economic niches.
Top Sub-Industries by Company Count
| Sector | Sub-Industry | Companies |
|---|---|---|
| Health Care | Health Care Equipment | 17 |
| Utilities | Electric Utilities | 15 |
| Information Technology | Application Software | 14 |
| Information Technology | Semiconductors | 14 |
| Industrials | Industrial Machinery & Components | 14 |
| Utilities | Multi-Utilities | 12 |
| Financials | Asset Management & Custody Banks | 12 |
| Industrials | Aerospace & Defense | 12 |
| Consumer Staples | Packaged Foods & Meats | 11 |
| Energy | Oil & Gas Exploration & Production | 10 |
Large-Cap, Mid-Cap, and Lower-Cap Performance Explained
While the S&P 500 is a large-cap index, understanding how different market-capitalization segments perform relative to each other provides valuable context for portfolio construction.
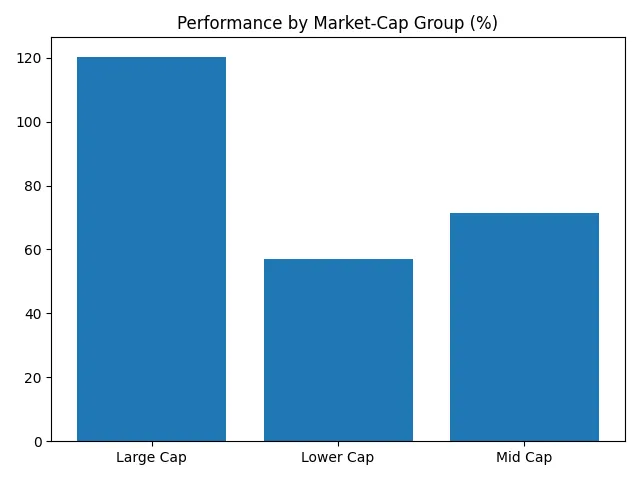
Market-Cap Group Performance
| Market-Cap Group | Avg Return (%) |
|---|---|
| Large Cap | 120.34% |
| Mid Cap | 71.40% |
| Lower Cap | 57.08% |
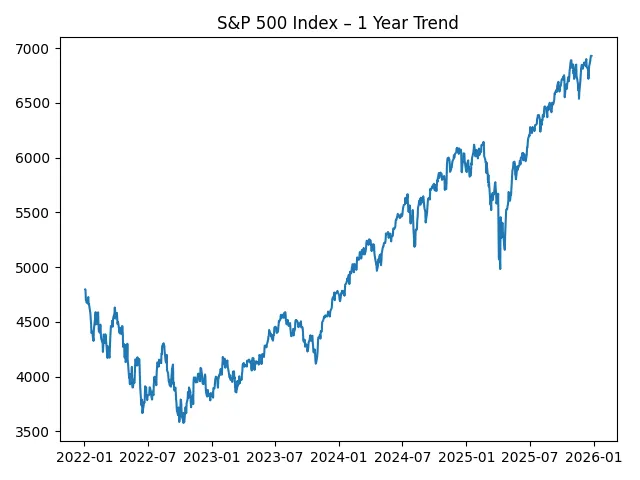
S&P 500 Index Trend Snapshot
The long-term trend of the index itself is perhaps the most powerful visual for understanding the equity market’s trajectory. Despite periodic drawdowns, the overall direction has historically been upward, reflecting economic growth and corporate profit expansion.
✅ S&P 500 Weekly Market Overview
NASDAQ Post IPO Performance Reality (2023–2025)
Decoding the US Economic Dashboard: A Complete Guide
S&P 500 Index Performance and Earnings Anatomy (2020–2025)
S&P 500 Stocks’ Performance Analysis Dashboard
SP500 Index Analysis Dashboard
How to Invest in the S&P 500: A Practical Guide
Understanding the index leads to the natural next question: how can one invest? Individual investors cannot buy the index directly, but can easily access its performance through low-cost, highly efficient financial products.
- Exchange-Traded Funds (ETFs): The most popular and accessible method. SPDR S&P 500 ETF Trust (SPY), the first-ever ETF, iShares Core S&P 500 ETF (IVV), and Vanguard S&P 500 ETF (VOO) are giant funds that track the index with extremely low fees. They trade like stocks throughout the day.
- Index Funds: Similar to ETFs in holdings but priced once daily. Vanguard 500 Index Fund (VFIAX) is a classic example. These are often favored for automated monthly investment plans in brokerage or retirement accounts.
- Mutual Funds: Many actively managed mutual funds use the S&P 500 as a benchmark, though consistently outperforming it over the long term is challenging for most.
Key Investment Considerations:
- Costs Are Critical: Always check the expense ratio. S&P 500 index funds and ETFs are renowned for ultra-low costs (often below 0.10% annually), which maximizes compound returns over decades.
- Embrace the Passive Strategy: Investing in an S&P 500 tracker is a passive, long-term “own the market” approach. It forgoes attempts to beat the market, aligning with the philosophy endorsed by investors like Warren Buffett for most individuals.
- Utilize Dollar-Cost Averaging (DCA): Investing a fixed amount regularly (e.g., monthly) smooths out purchase prices over time, buying more shares when prices are low and fewer when high. This disciplined strategy mitigates the impact of volatility and removes emotion from the process.
Frequently Asked Questions (FAQs)
Q: Does the S&P 500 pay dividends?
A: Yes, indirectly. The S&P 500 is a total return index, meaning its calculation assumes dividends are reinvested. When you invest in an S&P 500 ETF or fund, you receive the dividend payments from the underlying companies (usually quarterly), which you can take as cash or reinvest automatically.
Q: What are the main risks of investing in the S&P 500?
A: The primary risk is market risk (systematic risk). A major economic recession or crisis can cause its value to fall substantially. It does not offer the safety of government bonds or the diversification of global markets. Concentration risk—where the performance is heavily influenced by its largest holdings—is also a growing consideration for investors.
Q: How often is the S&P 500 rebalanced, and how are companies added/removed?
A: The index committee makes changes as needed, not on a fixed schedule. A company is typically added only when a current member is removed (due to acquisition, bankruptcy, or failing criteria). Key criteria include a minimum market cap (~$15.8B), sufficient liquidity, financial viability (positive earnings), and U.S. domicile.
Q: Can you lose all your money investing in an S&P 500 index fund?
A: It is extraordinarily improbable. For this to happen, all 500 of America’s largest companies would have to become worthless simultaneously—a scenario tantamount to the total collapse of the U.S. economy and financial system. The realistic risk is a prolonged market downturn where your investment loses significant value for a period of years, which has occurred historically.
Q: What is the difference between the S&P 500, the Dow Jones, and the Nasdaq?
A: The S&P 500 is a market-cap-weighted index of 500 large U.S. companies across all sectors. The Dow Jones Industrial Average (DJIA) is a price-weighted index of only 30 large, “blue-chip” companies. The Nasdaq Composite is a market-cap-weighted index of all stocks listed on the Nasdaq exchange, heavily dominated by technology and growth companies.
Final Thoughts
The S&P 500 remains the most trusted and significant indicator of U.S. equity market performance. Its construction, historical evolution, and sector dynamics tell the story of the American economy. By understanding its structure—from its market-cap weighting and sector composition to its historical context and the practical means of investment—individuals can navigate financial markets with greater confidence, clarity, and a solid foundation for long-term investment strategy.
Written By-Md Kollol Hossain, CEO, CapitalinsightBD
Data Source: Yfinance and SEC, USA
This content is for informational purposes only and does not constitute financial, investment, or tax advice. Past performance is not indicative of future results. All investments involve risk, including the possible loss of principal. Please consult with a qualified financial professional before making any investment decisions.