The Seasonal Market Dashboard delivers a comprehensive, data-driven view of U.S. equity markets by combining historical seasonal patterns, real-time price behavior, and momentum analytics across S&P 500 and NASDAQ-100 stocks. Covering more than 500 large-cap and growth equities across key sectors such as technology, industrials, energy, healthcare, consumer discretionary, financials, and utilities, this dashboard helps investors identify historically strong and weak months, extreme high-low positioning, momentum shifts, and volatility trends. By analyzing multi-year monthly price cycles, sector seasonality, and stock-specific behavior, the platform highlights potential buying opportunities during seasonal lows and profit-taking zones during historical peaks. Designed for swing traders, position traders, and long-term investors alike, the dashboard integrates seasonal trends, momentum strength, market breadth, volume leadership, and ticker-level insights to support smarter timing, risk management, and portfolio decision-making in both bullish and corrective market phases.
📚 Frequently Asked Questions (FAQ)
🤔 General Questions
Q1: What is the Seasonal Market Dashboard?
A: The Seasonal Market Dashboard is an advanced market intelligence platform that analyzes 518 major stocks from the S&P 500 and NASDAQ-100 using 5-year historical seasonal patterns. It identifies extreme seasonal opportunities, tracks real-time momentum, and provides actionable trading signals based on historical data patterns.
Q2: How often is the data updated?
A: Our dashboard is updated daily with the latest market data. Historical analysis includes 5 years of daily data, and 2-year price charts for comprehensive seasonal pattern recognition.
Q3: How many stocks are analyzed?
A: We analyze 518 unique stocks from:
- S&P 500 companies
- NASDAQ-100 companies
All stocks are combined into a single, deduplicated database for comprehensive analysis.
📊 Data & Analysis Questions
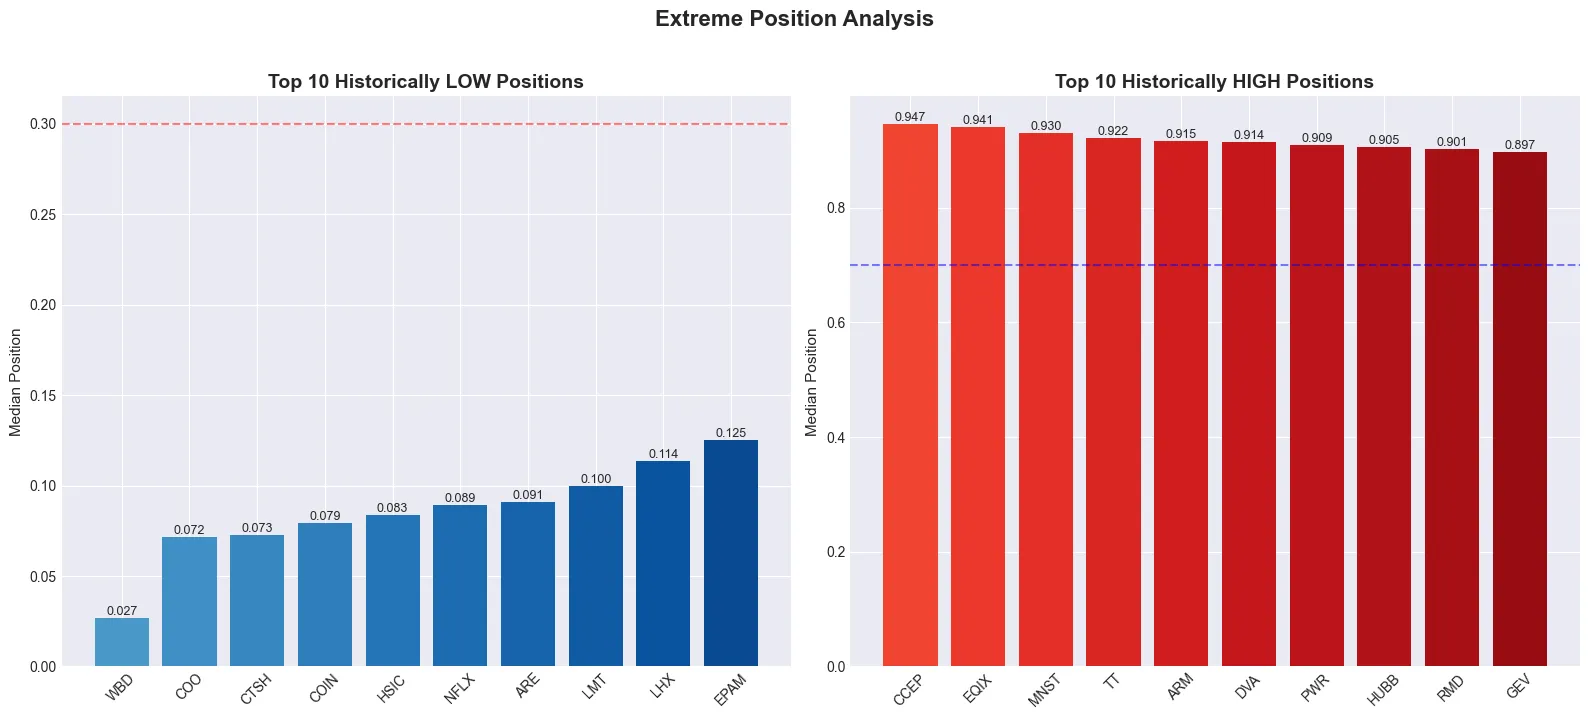
Q4: What does “Extreme Patterns” mean?
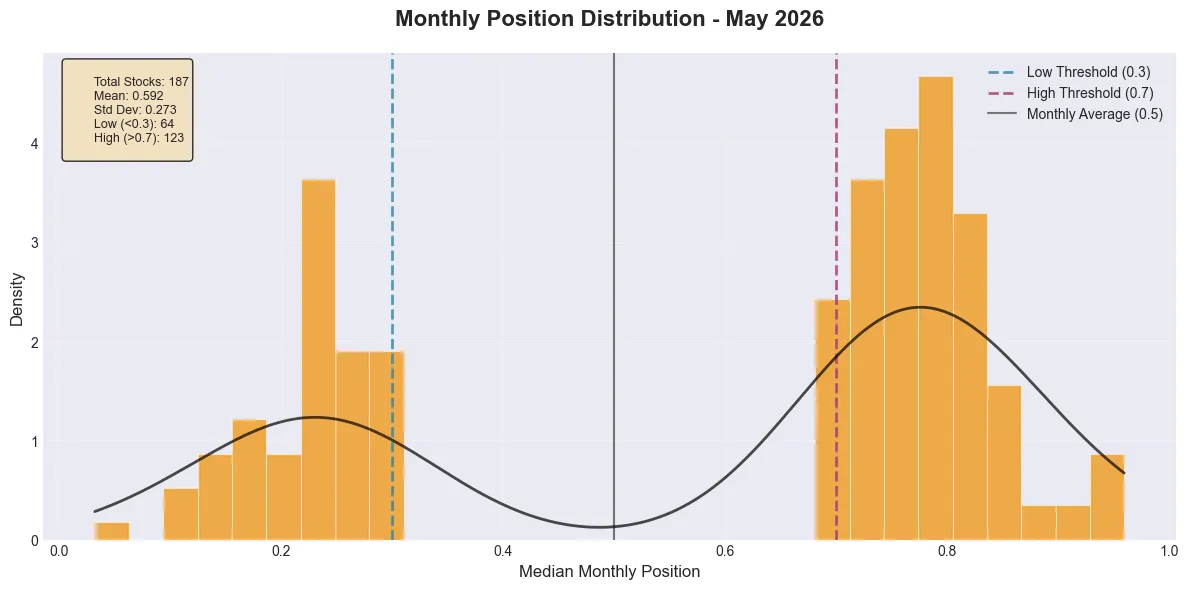
A: Extreme Patterns refer to stocks that are currently trading at historically low or high positions within their monthly ranges. These are identified using:
- Low threshold: Position ≤ 0.30 (30%)
- High threshold: Position ≥ 0.70 (70%)
Currently, 158 stocks (30.5% of total) meet these extreme criteria.
Q5: How is “Position” calculated?
A: Position measures where a stock’s current price is within its monthly range:
text
Position = (Current Price - Month Low) / (Month High - Month Low)
- 0.0 – 0.3: Historically LOW (potential buying opportunity)
- 0.3 – 0.7: NEUTRAL zone
- 0.7 – 1.0: Historically HIGH (potential profit-taking zone)
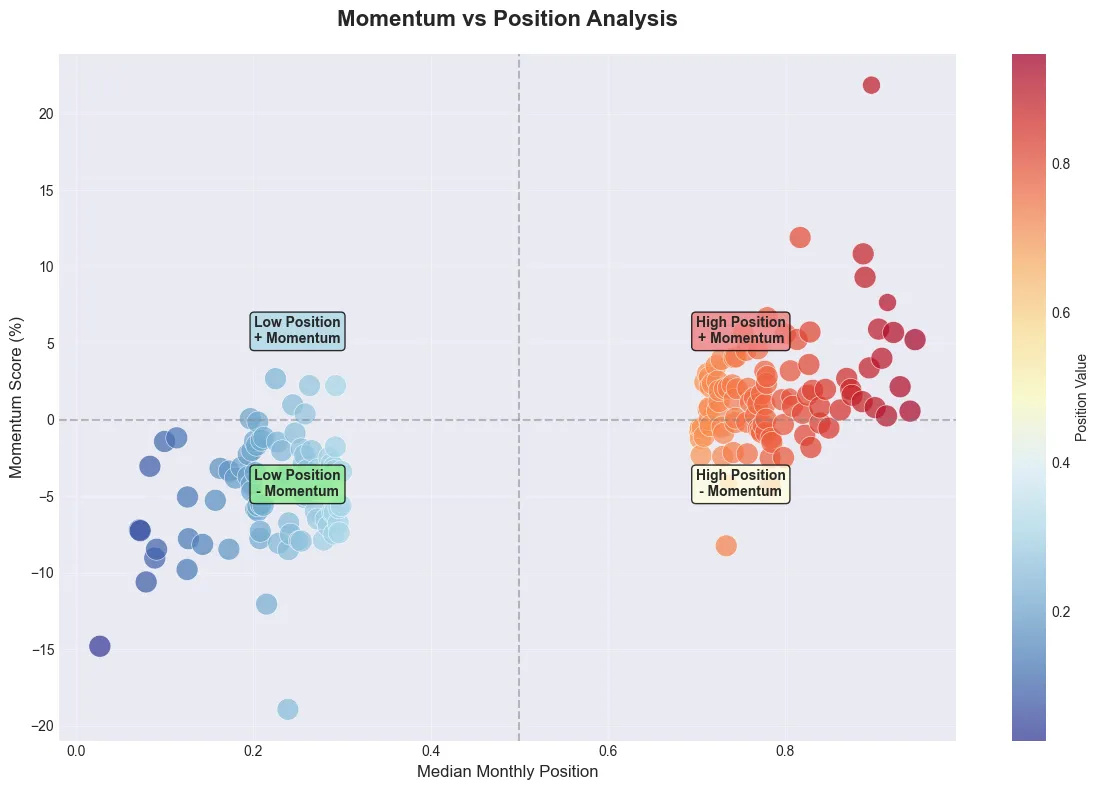
Q6: What is “Momentum Score”?
A: Momentum Score measures the rate of price acceleration over recent periods. A positive score indicates upward momentum, while a negative score suggests downward pressure. The current market average is +3.40%.
Q7: How are “Yearly High/Low Values” determined?
A: For each of the last 5 years, we identify:
- Yearly High: The highest monthly high price
- Yearly Low: The lowest monthly low price
This creates 10 data points (5 years × 2 values) that reveal seasonal patterns in yearly peaks and troughs.
📈 Trading & Investment Questions
Q8: How can I use this for trading decisions?
A: Our dashboard helps with:
- Identifying opportunities: Stocks in historically low positions (≤0.30)
- Risk management: Stocks in historically high positions (≥0.70)
- Market timing: Seasonal pattern recognition
- Position sizing: Using volatility and momentum data
- Trend following: Momentum analysis and position trends
Q9: What does “19.6% Low / 80.4% High” mean?
A: This indicates the current market distribution:
- 19.6% of stocks (31 stocks) are in historically LOW positions → Potential buying opportunities
- 80.4% of stocks (127 stocks) are in historically HIGH positions → Consider profit-taking
- Average market position is 0.677 (upper half of ranges)
Q10: Is this suitable for long-term investing?
A: Yes! While useful for short-term trading, our seasonal analysis also benefits long-term investors through:
- Entry timing: Better entry points during seasonal lows
- Exit strategy: Identifying seasonal highs for partial profit-taking
- Portfolio rebalancing: Using seasonal patterns for allocation adjustments
- Risk assessment: Understanding historical volatility patterns
🔍 Technical Questions
Q11: What data sources are used?
A: We use multiple reliable data sources (Yfinance mainly) including:
- Historical price data (5+ years)
- Real-time market feeds
- Volume and volatility metrics
- Corporate action-adjusted data
All data is cleaned, normalized, and validated for accuracy.
Q12: How accurate is the seasonal analysis?
A: Our analysis is based on statistical patterns over 5 years of historical data. While past performance doesn’t guarantee future results, seasonal patterns have shown statistical significance in many market studies. We recommend using our analysis as one tool among many in your decision-making process.
Q13: Can I analyze individual stocks?
A: Absolutely! Use our Ticker Analysis Tool (top-right panel) to:
- Select any of 518 stocks
- View detailed 5-year seasonal analysis
- See monthly position charts
- Access historical price tables
- Get yearly high/low patterns
- Review additional statistics
Q14: What timeframes are analyzed?
A: We analyze multiple timeframes:
- Current month: Daily trading data
- Monthly: 5 years of monthly patterns (60 months)
- Yearly: 5 years of annual highs/lows
- Real-time: Daily updates and momentum calculations
💡 Usage & Interpretation
Q15: How do I interpret the charts?
A: Our charts include:
- 📈 Position Distribution: Shows market concentration in low/neutral/high zones
- 🚀 Top Performers: Best momentum and extreme position stocks
- 📊 Momentum Analysis: Market-wide momentum trends
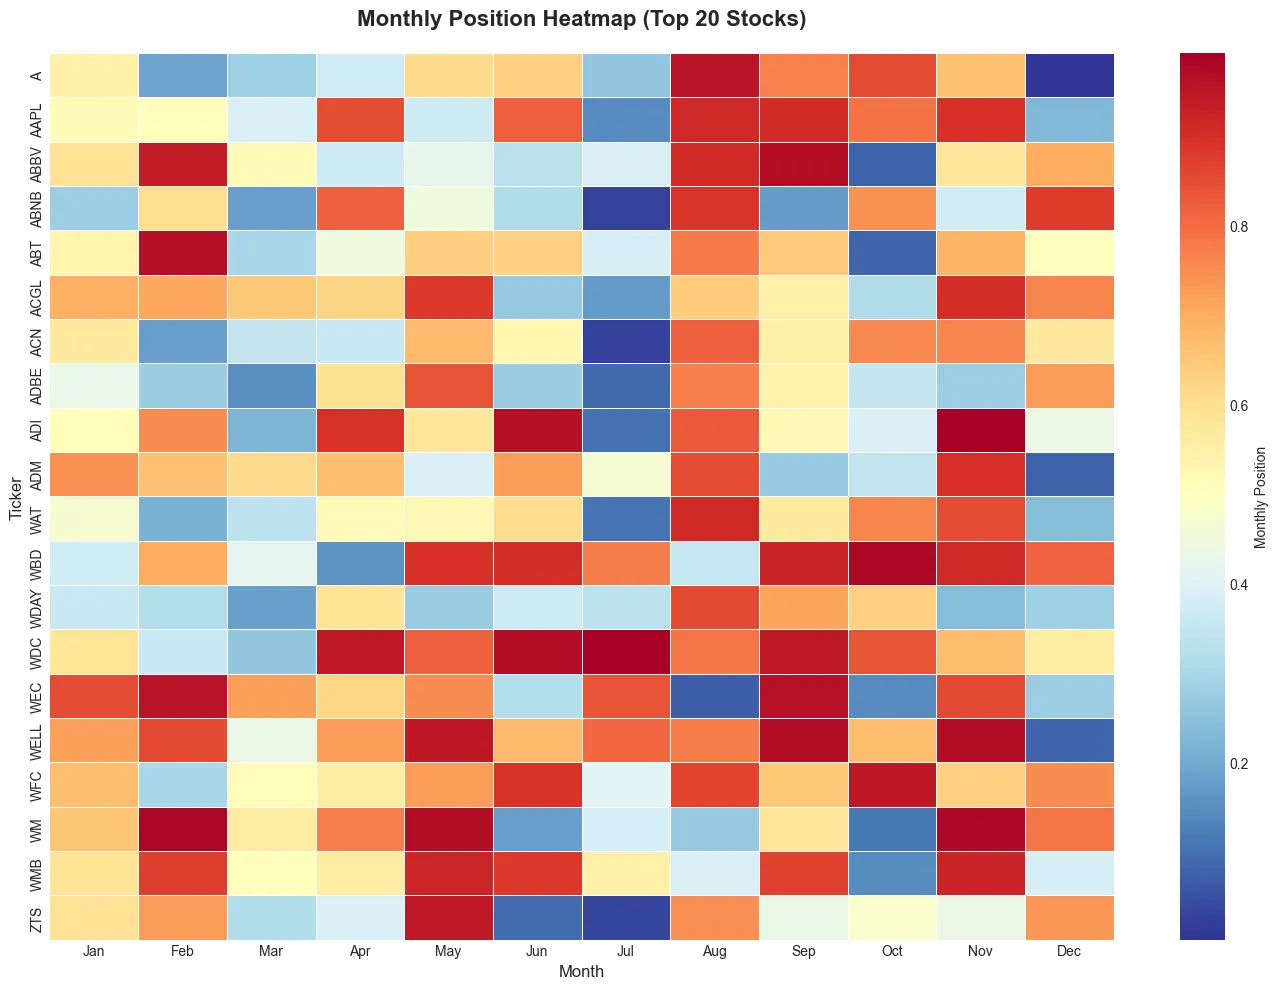
- 📅 Monthly Patterns: Historical seasonal trends
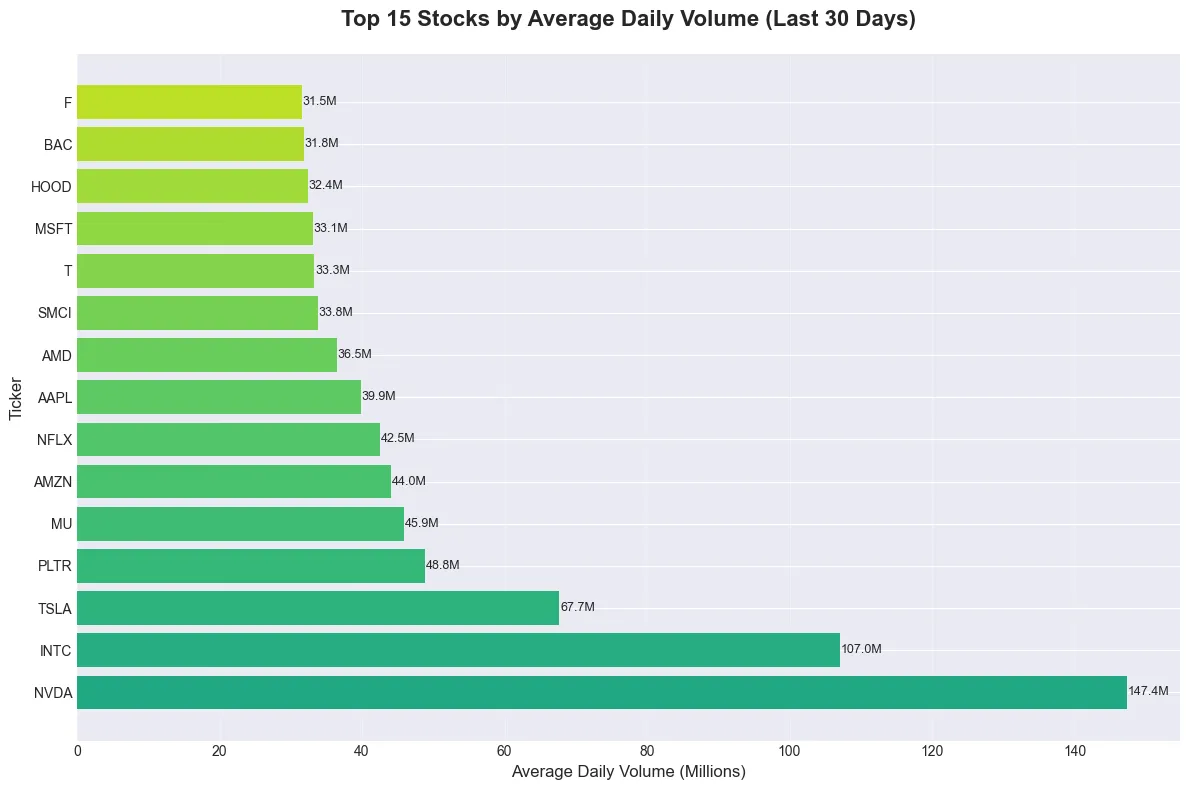
- 📊 Volume Leaders: Most actively traded extreme pattern stocks
Q16: What do the color codes mean in tables?
A: We use visual indicators:
- 🟢 Green/Change-positive: Positive price changes
- 🔴 Red/Change-negative: Negative price changes
- 🔵 Blue/Status-low: Historically low positions (≤0.30)
- 🟣 Purple/Status-high: Historically high positions (≥0.70)
- 🟠 Orange/Status-neutral: Neutral positions (0.30-0.70)
Q17: Can I export the data?
A: Currently, data is view-only within the dashboard. However, all displayed information can be screenshot or manually recorded for personal analysis. Future updates may include export functionality.
Q18: Is there mobile support?
A: Yes! Our dashboard is fully responsive and works on:
- Desktop computers (optimal experience)
- Tablets (good experience)
- Mobile phones (basic functionality)
Charts and tables adjust automatically to screen size.
🔒 Security & Privacy
Q19: Is my data secure?
A: We take data security seriously:
- No personal data collection (anonymous usage)
- Secure connections (HTTPS encryption)
- Regular security audits
- Compliance with financial data regulations
Q20: Do you store my search history or selections?
A: No. All interactions are session-based and temporary. Your ticker selections, filters, and preferences are not stored on our servers and reset when you leave the page.
🆘 Support & Contact
Q21: Where can I report issues or provide feedback?
A: We welcome feedback! Please contact us through:
- Contact us form
- Email support (contact details in footer)
Q22: Are there tutorials or guides available?
A: Yes! We provide:
- Interactive tooltips (hover over any metric)
- Visual indicators (color coding and icons)
- This FAQ section
Q23: Is this tool free to use?
A: Currently, the Seasonal Market Dashboard is available free of charge. We believe in democratizing market intelligence and making advanced analysis accessible to all investors and traders.
Q24: Who created this dashboard?
A: This dashboard was developed by financial data scientists and quantitative analysts with expertise in:
- Seasonal pattern recognition
- Statistical market analysis
- Data visualization
- Investment strategy development
Md Kollol Hossain, CEO, CapitalinsightBD
S&P 500 Stocks’ Performance Analysis Dashboard
SP500 Stocks’ price closer to 52week’s high
S&P 500 Index Performance and Earnings Anatomy (2020–2025)
Seasonal Market Dashboard
Advanced market intelligence powered by historical seasonal analysis and real-time data patterns
Stocks in Database
517
S&P 500 + NASDAQ-100 (unique)
Extreme Patterns
175
Low/High threshold today
Avg Position
65.4%
Historical pattern strength
Strong Seasonal
40
Rank 1-2 Patterns
Last Updated
22:26
Jun 17, 2026
Analyzing 517 stocks from database. 175 stocks meet extreme low/high seasonal pattern criteria today.
💭 Market Commentary & Analysis
📊 Visual Analytics & Charts
📈 Position Distribution
Loading visualization...
🚀 Top Performers
Loading visualization...
📊 Momentum Analysis
Loading visualization...
📅 Monthly Patterns
Loading visualization...
📊 Volume Leaders
Loading visualization...
📋 Data Tables & Analysis
📉 Top Historically Low Stocks
15 records total| Ticker | Median Position | Avg Month High | Avg Month Low | Avg Month Avg | Momentum Score | Obs Count | Rank Low | Rank High | Analysis Date |
|---|---|---|---|---|---|---|---|---|---|
| LULU | 0.11% | $302.43 | $244.05 | $269.34 | -7.37 | 5 | 1.000 | - | Jun 17, 2026 |
| FANG | 0.11% | $164.41 | $140.97 | $151.60 | -3.51 | 5 | $2.00 | - | Jun 17, 2026 |
| VLTO | 0.15% | $96.56 | $91.00 | $93.89 | -0.79 | 3 | $3.00 | - | Jun 17, 2026 |
| DOW | 0.15% | $44.33 | $37.50 | $40.82 | -6.22 | 5 | $4.00 | - | Jun 17, 2026 |
| EQT | 0.16% | $49.05 | $40.69 | $45.09 | -4.15 | 5 | $5.00 | - | Jun 17, 2026 |
| MSTR | 0.17% | $159.34 | $129.12 | $142.01 | -10.25 | 5 | $6.00 | - | Jun 17, 2026 |
| HPQ | 0.17% | $30.74 | $26.60 | $28.39 | -5.34 | 5 | $7.00 | - | Jun 17, 2026 |
| ON | 0.17% | $85.93 | $69.99 | $78.09 | +1.65 | 5 | $8.00 | - | Jun 17, 2026 |
| BNY | 0.18% | $78.42 | $72.53 | $73.33 | +1.66 | 5 | $9.00 | - | Jun 17, 2026 |
| PCG | 0.18% | $16.42 | $14.38 | $15.29 | -7.72 | 5 | $10.00 | - | Jun 17, 2026 |
| HSY | 0.18% | $200.84 | $182.89 | $191.73 | -3.13 | 5 | $11.00 | - | Jun 17, 2026 |
| CPB | 0.19% | $37.76 | $33.54 | $35.42 | -3.48 | 5 | $12.00 | - | Jun 17, 2026 |
| MU | 0.20% | $308.01 | $237.50 | $275.09 | +2.11 | 5 | $13.00 | - | Jun 17, 2026 |
| MKC | 0.21% | $74.05 | $67.10 | $70.31 | -1.57 | 5 | $14.00 | - | Jun 17, 2026 |
| EXE | 0.21% | $94.09 | $81.57 | $87.86 | -4.07 | 5 | $15.00 | - | Jun 17, 2026 |
📈 Top Historically High Stocks
15 records total| Ticker | Median Position | Avg Month High | Avg Month Low | Avg Month Avg | Momentum Score | Obs Count | Rank Low | Rank High | Analysis Date |
|---|---|---|---|---|---|---|---|---|---|
| NCLH | 0.95% | $19.67 | $15.22 | $17.44 | +10.45 | 5 | - | 1.000 | Jun 17, 2026 |
| CCL | 0.95% | $22.35 | $16.41 | $19.05 | +16.37 | 5 | - | $2.00 | Jun 17, 2026 |
| HWM | 0.94% | $128.86 | $111.48 | $118.67 | +2.96 | 5 | - | $3.00 | Jun 17, 2026 |
| ROK | 0.93% | $320.34 | $286.84 | $304.46 | +5.12 | 5 | - | $4.00 | Jun 17, 2026 |
| TYL | 0.93% | $443.43 | $397.49 | $419.67 | -0.47 | 5 | - | $5.00 | Jun 17, 2026 |
| F | 0.93% | $12.65 | $10.49 | $11.50 | -0.92 | 5 | - | $6.00 | Jun 17, 2026 |
| RJF | 0.92% | $125.75 | $112.52 | $119.29 | +4.44 | 5 | - | $7.00 | Jun 17, 2026 |
| GEV | 0.92% | $594.02 | $489.66 | $537.88 | +5.90 | 3 | - | $8.00 | Jun 17, 2026 |
| HLT | 0.92% | $226.35 | $200.20 | $213.29 | +1.72 | 5 | - | $9.00 | Jun 17, 2026 |
| JPM | 0.92% | $215.85 | $192.75 | $202.76 | +2.67 | 5 | - | $10.00 | Jun 17, 2026 |
| INTU | 0.91% | $535.10 | $464.40 | $494.89 | +0.41 | 5 | - | $11.00 | Jun 17, 2026 |
| ALNY | 0.91% | $248.82 | $204.90 | $222.19 | +16.60 | 5 | - | $12.00 | Jun 17, 2026 |
| CAH | 0.90% | $128.73 | $112.75 | $120.51 | +6.40 | 5 | - | $13.00 | Jun 17, 2026 |
| GL | 0.90% | $116.83 | $105.48 | $111.76 | +3.86 | 5 | - | $14.00 | Jun 17, 2026 |
| MGM | 0.90% | $42.28 | $36.18 | $39.09 | +4.27 | 5 | - | $15.00 | Jun 17, 2026 |
🏆 Top Historical High Seasonal Patterns (Rank 1-2)
23 records total| Ticker | Season Start Name | Season End Name | Seasonal Frequency | Highest Frequency Month | Frequency | Confidence Score | Rank |
|---|---|---|---|---|---|---|---|
| KHC | Jan | Jun | 6 | - | 0 | 100.0% | 🥇 Rank 1 |
| YUM | Dec | May | 6 | - | 0 | 100.0% | 🥇 Rank 1 |
| AWK | Dec | Apr | 5 | - | 0 | 83.0% | 🥈 Rank 2 |
| AXP | Oct | Feb | 5 | Dec | 2 | 83.0% | 🥈 Rank 2 |
| CBRE | Oct | Feb | 5 | Dec | 2 | 83.0% | 🥈 Rank 2 |
| CPT | Nov | Mar | 5 | Feb | 2 | 83.0% | 🥈 Rank 2 |
| DGX | Oct | Feb | 5 | Jan | 2 | 83.0% | 🥈 Rank 2 |
| ECL | Oct | Feb | 5 | - | 0 | 83.0% | 🥈 Rank 2 |
| FITB | Oct | Feb | 5 | Feb | 2 | 83.0% | 🥈 Rank 2 |
| GE | Oct | Feb | 5 | Dec | 2 | 83.0% | 🥈 Rank 2 |
| HBAN | Oct | Feb | 5 | Feb | 2 | 83.0% | 🥈 Rank 2 |
| IQV | Nov | Mar | 5 | Jan | 2 | 83.0% | 🥈 Rank 2 |
| ITW | Nov | Mar | 5 | Dec | 2 | 83.0% | 🥈 Rank 2 |
| KEY | Oct | Feb | 5 | Feb | 2 | 83.0% | 🥈 Rank 2 |
| LH | Oct | Feb | 5 | Dec | 2 | 83.0% | 🥈 Rank 2 |
| MAA | Nov | Mar | 5 | Jan | 2 | 83.0% | 🥈 Rank 2 |
| MLM | Oct | Feb | 5 | Dec | 2 | 83.0% | 🥈 Rank 2 |
| NTAP | Sep | Jan | 5 | - | 0 | 83.0% | 🥈 Rank 2 |
| PNC | Oct | Feb | 5 | Jan | 2 | 83.0% | 🥈 Rank 2 |
| USB | Oct | Feb | 5 | Jan | 2 | 83.0% | 🥈 Rank 2 |
| VMC | Oct | Feb | 5 | - | 0 | 83.0% | 🥈 Rank 2 |
| VRT | Sep | Jan | 5 | - | 0 | 83.0% | 🥈 Rank 2 |
| ZBH | Feb | Jun | 5 | Apr | 2 | 83.0% | 🥈 Rank 2 |
🏆 Top Historical Low Seasonal Patterns (Rank 1-2)
17 records total| Ticker | Season Start Name | Season End Name | Seasonal Frequency | Highest Frequency Month | Frequency | Confidence Score | Rank |
|---|---|---|---|---|---|---|---|
| APD | Oct | Mar | 6 | - | 0 | 100.0% | 🥇 Rank 1 |
| NFLX | Jan | Jun | 6 | - | 0 | 100.0% | 🥇 Rank 1 |
| CTSH | Mar | Jul | 5 | - | 0 | 83.0% | 🥈 Rank 2 |
| EBAY | Oct | Feb | 5 | - | 0 | 83.0% | 🥈 Rank 2 |
| FSLR | Feb | Jun | 5 | - | 0 | 83.0% | 🥈 Rank 2 |
| HBAN | Mar | Jul | 5 | - | 0 | 83.0% | 🥈 Rank 2 |
| IR | Mar | Jul | 5 | - | 0 | 83.0% | 🥈 Rank 2 |
| KMI | Dec | Apr | 5 | Jan | 2 | 83.0% | 🥈 Rank 2 |
| MLM | Mar | Jul | 5 | - | 0 | 83.0% | 🥈 Rank 2 |
| NEM | Nov | Mar | 5 | Nov | 2 | 83.0% | 🥈 Rank 2 |
| NWS | Feb | Jun | 5 | - | 0 | 83.0% | 🥈 Rank 2 |
| NWSA | Feb | Jun | 5 | - | 0 | 83.0% | 🥈 Rank 2 |
| RJF | Apr | Aug | 5 | Apr | 2 | 83.0% | 🥈 Rank 2 |
| SCHW | Mar | Jul | 5 | - | 0 | 83.0% | 🥈 Rank 2 |
| SYF | Mar | Jul | 5 | - | 0 | 83.0% | 🥈 Rank 2 |
| VST | Jan | May | 5 | - | 0 | 83.0% | 🥈 Rank 2 |
| WTW | Apr | Aug | 5 | - | 0 | 83.0% | 🥈 Rank 2 |
🚀 Top Positive Momentum Stocks
15 records total| Ticker | Median Position | Avg Month High | Avg Month Low | Avg Month Avg | Momentum Score | Obs Count | Rank Low | Rank High | Analysis Date |
|---|---|---|---|---|---|---|---|---|---|
| ARM | 0.82% | $263.47 | $181.50 | $223.71 | +28.07 | 3 | - | $42.00 | Jun 17, 2026 |
| CVNA | 0.79% | $124.68 | $95.04 | $109.90 | +19.03 | 5 | - | $66.00 | Jun 17, 2026 |
| ALNY | 0.91% | $248.82 | $204.90 | $222.19 | +16.60 | 5 | - | $12.00 | Jun 17, 2026 |
| CCL | 0.95% | $22.35 | $16.41 | $19.05 | +16.37 | 5 | - | $2.00 | Jun 17, 2026 |
| INSM | 0.77% | $65.40 | $50.06 | $58.59 | +14.76 | 5 | - | $77.00 | Jun 17, 2026 |
| HOOD | 0.72% | $49.95 | $36.02 | $41.45 | +11.07 | 5 | - | $115.00 | Jun 17, 2026 |
| NCLH | 0.95% | $19.67 | $15.22 | $17.44 | +10.45 | 5 | - | 1.000 | Jun 17, 2026 |
| STX | 0.78% | $296.51 | $223.76 | $255.42 | +9.00 | 5 | - | $72.00 | Jun 17, 2026 |
| AMAT | 0.84% | $262.48 | $202.33 | $230.70 | +8.85 | 5 | - | $37.00 | Jun 17, 2026 |
| LRCX | 0.81% | $143.64 | $113.90 | $127.94 | +7.91 | 5 | - | $49.00 | Jun 17, 2026 |
| PANW | 0.86% | $180.04 | $153.75 | $167.28 | +7.89 | 5 | - | $25.00 | Jun 17, 2026 |
| CASY | 0.84% | $458.31 | $376.03 | $413.87 | +7.77 | 5 | - | $33.00 | Jun 17, 2026 |
| CAH | 0.90% | $128.73 | $112.75 | $120.51 | +6.40 | 5 | - | $13.00 | Jun 17, 2026 |
| GEV | 0.92% | $594.02 | $489.66 | $537.88 | +5.90 | 3 | - | $8.00 | Jun 17, 2026 |
| LII | 0.79% | $437.05 | $387.83 | $415.43 | +5.88 | 5 | - | $67.00 | Jun 17, 2026 |
📉 Top Negative Momentum Stocks
15 records total| Ticker | Median Position | Avg Month High | Avg Month Low | Avg Month Avg | Momentum Score | Obs Count | Rank Low | Rank High | Analysis Date |
|---|---|---|---|---|---|---|---|---|---|
| MSTR | 0.17% | $159.34 | $129.12 | $142.01 | -10.25 | 5 | $6.00 | - | Jun 17, 2026 |
| PCG | 0.18% | $16.42 | $14.38 | $15.29 | -7.72 | 5 | $10.00 | - | Jun 17, 2026 |
| APP | 0.29% | $241.89 | $183.08 | $209.54 | -7.47 | 5 | $40.00 | - | Jun 17, 2026 |
| LULU | 0.11% | $302.43 | $244.05 | $269.34 | -7.37 | 5 | 1.000 | - | Jun 17, 2026 |
| PSKY | 0.25% | $16.95 | $13.40 | $14.66 | -6.74 | 5 | $18.00 | - | Jun 17, 2026 |
| SW | 0.25% | $41.53 | $36.26 | $39.00 | -6.29 | 5 | $22.00 | - | Jun 17, 2026 |
| DOW | 0.15% | $44.33 | $37.50 | $40.82 | -6.22 | 5 | $4.00 | - | Jun 17, 2026 |
| HPQ | 0.17% | $30.74 | $26.60 | $28.39 | -5.34 | 5 | $7.00 | - | Jun 17, 2026 |
| APA | 0.29% | $32.99 | $26.78 | $29.99 | -4.23 | 5 | $42.00 | - | Jun 17, 2026 |
| APTV | 0.26% | $89.91 | $72.90 | $81.78 | -4.21 | 5 | $29.00 | - | Jun 17, 2026 |
| SMCI | 0.29% | $47.23 | $33.33 | $38.68 | -4.18 | 5 | $39.00 | - | Jun 17, 2026 |
| EQT | 0.16% | $49.05 | $40.69 | $45.09 | -4.15 | 5 | $5.00 | - | Jun 17, 2026 |
| EXE | 0.21% | $94.09 | $81.57 | $87.86 | -4.07 | 5 | $15.00 | - | Jun 17, 2026 |
| KHC | 0.25% | $29.95 | $27.25 | $28.56 | -3.99 | 5 | $19.00 | - | Jun 17, 2026 |
| DVN | 0.25% | $48.24 | $40.45 | $44.42 | -3.99 | 5 | $23.00 | - | Jun 17, 2026 |
⚡ Most Volatile Stocks
15 records total| Ticker | Median Position | Avg Month High | Avg Month Low | Avg Month Avg | Momentum Score | Obs Count | Rank Low | Rank High | Analysis Date | Monthly Range Pct |
|---|---|---|---|---|---|---|---|---|---|---|
| ARM | 0.82% | $263.47 | $181.50 | $223.71 | +28.07 | 3 | - | $42.00 | Jun 17, 2026 | 45.2 |
| SMCI | 0.29% | $47.23 | $33.33 | $38.68 | -4.18 | 5 | $39.00 | - | Jun 17, 2026 | 41.7 |
| HOOD | 0.72% | $49.95 | $36.02 | $41.45 | +11.07 | 5 | - | $115.00 | Jun 17, 2026 | 38.7 |
| CCL | 0.95% | $22.35 | $16.41 | $19.05 | +16.37 | 5 | - | $2.00 | Jun 17, 2026 | 36.2 |
| STX | 0.78% | $296.51 | $223.76 | $255.42 | +9.00 | 5 | - | $72.00 | Jun 17, 2026 | 32.5 |
| APP | 0.29% | $241.89 | $183.08 | $209.54 | -7.47 | 5 | $40.00 | - | Jun 17, 2026 | 32.1 |
| CVNA | 0.79% | $124.68 | $95.04 | $109.90 | +19.03 | 5 | - | $66.00 | Jun 17, 2026 | 31.2 |
| INSM | 0.77% | $65.40 | $50.06 | $58.59 | +14.76 | 5 | - | $77.00 | Jun 17, 2026 | 30.6 |
| AMAT | 0.84% | $262.48 | $202.33 | $230.70 | +8.85 | 5 | - | $37.00 | Jun 17, 2026 | 29.7 |
| MU | 0.20% | $308.01 | $237.50 | $275.09 | +2.11 | 5 | $13.00 | - | Jun 17, 2026 | 29.7 |
| NCLH | 0.95% | $19.67 | $15.22 | $17.44 | +10.45 | 5 | - | 1.000 | Jun 17, 2026 | 29.2 |
| PSKY | 0.25% | $16.95 | $13.40 | $14.66 | -6.74 | 5 | $18.00 | - | Jun 17, 2026 | 26.5 |
| ADBE | 0.28% | $443.21 | $351.25 | $397.34 | -0.25 | 5 | $36.00 | - | Jun 17, 2026 | 26.2 |
| LRCX | 0.81% | $143.64 | $113.90 | $127.94 | +7.91 | 5 | - | $49.00 | Jun 17, 2026 | 26.1 |
| LULU | 0.11% | $302.43 | $244.05 | $269.34 | -7.37 | 5 | 1.000 | - | Jun 17, 2026 | 23.9 |
📅 Monthly Trends Analysis
540 records total| Ticker | Year | Month | Month High | Month Low | Month Avg | Month Position | Obs Count | Month Name | Year Month |
|---|---|---|---|---|---|---|---|---|---|
| ALNY | 2025 | 1 | $287.22 | $231.00 | $256.25 | 0.72% | 20 | Jan | 202501 |
| ALNY | 2025 | 2 | $279.24 | $236.50 | $259.51 | 0.24% | 19 | Feb | 202502 |
| ALNY | 2025 | 3 | $300.90 | $230.79 | $255.44 | 0.56% | 21 | Mar | 202503 |
| ALNY | 2025 | 4 | $273.61 | $205.87 | $242.95 | 0.85% | 21 | Apr | 202504 |
| ALNY | 2025 | 5 | $306.00 | $245.96 | $278.35 | 0.98% | 21 | May | 202505 |
| ALNY | 2025 | 6 | $327.21 | $295.82 | $310.42 | 0.96% | 20 | Jun | 202506 |
| ALNY | 2025 | 7 | $402.43 | $309.57 | $327.02 | 0.89% | 22 | Jul | 202507 |
| ALNY | 2025 | 8 | $469.81 | $382.19 | $441.66 | 0.73% | 21 | Aug | 202508 |
| ALNY | 2025 | 9 | $484.21 | $441.50 | $456.76 | 0.34% | 21 | Sep | 202509 |
| ALNY | 2025 | 10 | $495.55 | $436.51 | $466.27 | 0.33% | 23 | Oct | 202510 |
| ALNY | 2025 | 11 | $469.11 | $417.00 | $444.79 | 0.66% | 19 | Nov | 202511 |
| ALNY | 2025 | 12 | $479.79 | $387.03 | $415.84 | 0.11% | 22 | Dec | 202512 |
| ALNY | 2026 | 1 | $427.05 | $336.39 | $372.52 | 0.02% | 20 | Jan | 202601 |
| ALNY | 2026 | 2 | $355.49 | $298.00 | $330.79 | 0.61% | 19 | Feb | 202602 |
| ALNY | 2026 | 3 | $334.42 | $299.69 | $319.21 | 0.90% | 22 | Mar | 202603 |
| ALNY | 2026 | 4 | $343.36 | $287.00 | $317.82 | 0.40% | 21 | Apr | 202604 |
| ALNY | 2026 | 5 | $311.88 | $284.28 | $295.65 | 0.64% | 20 | May | 202605 |
| ALNY | 2026 | 6 | $310.53 | $276.94 | $291.29 | 0.17% | 13 | Jun | 202606 |
| BNY | 2025 | 1 | $87.70 | $74.91 | $79.36 | 0.70% | 20 | Jan | 202501 |
| BNY | 2025 | 2 | $89.44 | $83.75 | $84.59 | 0.53% | 19 | Feb | 202502 |
| BNY | 2025 | 3 | $90.34 | $79.24 | $81.80 | 0.23% | 21 | Mar | 202503 |
| BNY | 2025 | 4 | $84.55 | $70.46 | $76.11 | 0.60% | 21 | Apr | 202504 |
| BNY | 2025 | 5 | $90.63 | $79.72 | $85.55 | 0.67% | 21 | May | 202505 |
| BNY | 2025 | 6 | $92.64 | $87.41 | $88.34 | 0.39% | 20 | Jun | 202506 |
| BNY | 2025 | 7 | $103.16 | $89.64 | $95.08 | 0.77% | 22 | Jul | 202507 |
| BNY | 2025 | 8 | $106.57 | $98.40 | $101.28 | 0.71% | 21 | Aug | 202508 |
| BNY | 2025 | 9 | $110.87 | $102.63 | $105.41 | 0.59% | 21 | Sep | 202509 |
| BNY | 2025 | 10 | $110.19 | $103.11 | $105.73 | 0.55% | 23 | Oct | 202510 |
| BNY | 2025 | 11 | $113.74 | $105.42 | $108.28 | 0.69% | 19 | Nov | 202511 |
| BNY | 2025 | 12 | $119.40 | $111.43 | $114.72 | 0.46% | 22 | Dec | 202512 |
| BNY | 2026 | 1 | $125.89 | $115.31 | $119.59 | 0.39% | 20 | Jan | 202601 |
| BNY | 2026 | 2 | $128.76 | $112.83 | $119.70 | 0.36% | 19 | Feb | 202602 |
| BNY | 2026 | 3 | $120.41 | $111.71 | $116.00 | 0.74% | 22 | Mar | 202603 |
| BNY | 2026 | 4 | $139.15 | $118.58 | $130.55 | 0.77% | 21 | Apr | 202604 |
| BNY | 2026 | 5 | $141.65 | $130.16 | $135.69 | 0.81% | 20 | May | 202605 |
| BNY | 2026 | 6 | $146.74 | $137.50 | $142.67 | 0.93% | 13 | Jun | 202606 |
| CAH | 2025 | 1 | $131.19 | $116.07 | $123.36 | 0.40% | 20 | Jan | 202501 |
| CAH | 2025 | 2 | $128.91 | $121.47 | $125.53 | 0.86% | 19 | Feb | 202502 |
| CAH | 2025 | 3 | $136.90 | $120.74 | $128.62 | 0.95% | 21 | Mar | 202503 |
| CAH | 2025 | 4 | $140.49 | $119.66 | $132.85 | 0.98% | 21 | Apr | 202504 |
| CAH | 2025 | 5 | $155.07 | $135.51 | $150.23 | 0.90% | 21 | May | 202505 |
| CAH | 2025 | 6 | $166.93 | $150.30 | $158.83 | 0.98% | 20 | Jun | 202506 |
| CAH | 2025 | 7 | $167.47 | $151.72 | $159.50 | 0.17% | 22 | Jul | 202507 |
| CAH | 2025 | 8 | $158.72 | $136.96 | $150.78 | 0.50% | 21 | Aug | 202508 |
| CAH | 2025 | 9 | $156.80 | $145.03 | $150.18 | 0.94% | 21 | Sep | 202509 |
| CAH | 2025 | 10 | $197.18 | $150.41 | $160.32 | 0.85% | 23 | Oct | 202510 |
| CAH | 2025 | 11 | $214.40 | $187.68 | $204.67 | 0.90% | 19 | Nov | 202511 |
| CAH | 2025 | 12 | $213.01 | $195.05 | $201.74 | 0.55% | 22 | Dec | 202512 |
| CAH | 2026 | 1 | $216.51 | $199.95 | $208.81 | 0.90% | 20 | Jan | 202601 |
| CAH | 2026 | 2 | $230.81 | $205.87 | $222.87 | 0.94% | 19 | Feb | 202602 |
| CAH | 2026 | 3 | $233.60 | $203.86 | $214.80 | 0.25% | 22 | Mar | 202603 |
| CAH | 2026 | 4 | $217.77 | $185.80 | $209.09 | 0.22% | 21 | Apr | 202604 |
| CAH | 2026 | 5 | $203.96 | $180.45 | $194.41 | 0.70% | 20 | May | 202605 |
| CAH | 2026 | 6 | $229.78 | $194.00 | $211.71 | 0.90% | 13 | Jun | 202606 |
| CCL | 2025 | 1 | $28.72 | $23.27 | $25.47 | 0.81% | 20 | Jan | 202501 |
| CCL | 2025 | 2 | $27.82 | $22.82 | $25.46 | 0.22% | 19 | Feb | 202502 |
| CCL | 2025 | 3 | $24.47 | $18.16 | $20.65 | 0.22% | 21 | Mar | 202503 |
| CCL | 2025 | 4 | $20.05 | $15.07 | $18.08 | 0.66% | 21 | Apr | 202504 |
| CCL | 2025 | 5 | $23.67 | $18.51 | $21.79 | 0.91% | 21 | May | 202505 |
| CCL | 2025 | 6 | $28.18 | $22.11 | $24.47 | 0.99% | 20 | Jun | 202506 |
| CCL | 2025 | 7 | $31.01 | $28.07 | $29.48 | 0.58% | 22 | Jul | 202507 |
| CCL | 2025 | 8 | $32.77 | $28.07 | $30.13 | 0.81% | 21 | Aug | 202508 |
| CCL | 2025 | 9 | $32.80 | $28.59 | $31.00 | 0.08% | 21 | Sep | 202509 |
| CCL | 2025 | 10 | $30.37 | $27.47 | $28.74 | 0.47% | 23 | Oct | 202510 |
| CCL | 2025 | 11 | $28.96 | $24.60 | $26.24 | 0.27% | 19 | Nov | 202511 |
| CCL | 2025 | 12 | $32.89 | $25.27 | $28.41 | 0.69% | 22 | Dec | 202512 |
| CCL | 2026 | 1 | $32.80 | $27.76 | $30.12 | 0.45% | 20 | Jan | 202601 |
| CCL | 2026 | 2 | $34.03 | $29.95 | $32.22 | 0.39% | 19 | Feb | 202602 |
| CCL | 2026 | 3 | $29.75 | $23.47 | $25.64 | 0.38% | 22 | Mar | 202603 |
| CCL | 2026 | 4 | $30.16 | $24.74 | $27.21 | 0.33% | 21 | Apr | 202604 |
| CCL | 2026 | 5 | $28.40 | $23.45 | $26.09 | 0.93% | 20 | May | 202605 |
| CCL | 2026 | 6 | $31.59 | $25.65 | $28.20 | 0.72% | 13 | Jun | 202606 |
| CPB | 2025 | 1 | $40.23 | $35.79 | $37.45 | 0.25% | 20 | Jan | 202501 |
| CPB | 2025 | 2 | $40.27 | $35.14 | $36.98 | 0.58% | 19 | Feb | 202502 |
| CPB | 2025 | 3 | $41.73 | $35.93 | $37.47 | 0.36% | 21 | Mar | 202503 |
| CPB | 2025 | 4 | $38.87 | $33.98 | $36.23 | 0.22% | 21 | Apr | 202504 |
| CPB | 2025 | 5 | $34.86 | $31.67 | $33.61 | 0.33% | 21 | May | 202505 |
| CPB | 2025 | 6 | $33.64 | $29.29 | $31.47 | 0.04% | 20 | Jun | 202506 |
| CPB | 2025 | 7 | $32.60 | $28.60 | $30.68 | 0.62% | 22 | Jul | 202507 |
| CPB | 2025 | 8 | $32.51 | $30.28 | $31.52 | 0.35% | 21 | Aug | 202508 |
| CPB | 2025 | 9 | $33.25 | $29.92 | $32.15 | 0.24% | 21 | Sep | 202509 |
| CPB | 2025 | 10 | $31.61 | $29.25 | $30.34 | 0.18% | 23 | Oct | 202510 |
| CPB | 2025 | 11 | $31.56 | $29.17 | $30.24 | 0.36% | 19 | Nov | 202511 |
| CPB | 2025 | 12 | $30.28 | $27.23 | $28.33 | 0.07% | 22 | Dec | 202512 |
| CPB | 2026 | 1 | $28.12 | $25.62 | $26.69 | 0.94% | 20 | Jan | 202601 |
| CPB | 2026 | 2 | $29.99 | $26.11 | $27.90 | 0.22% | 19 | Feb | 202602 |
| CPB | 2026 | 3 | $26.79 | $20.62 | $22.77 | 0.27% | 22 | Mar | 202603 |
| CPB | 2026 | 4 | $22.46 | $19.76 | $20.89 | 0.38% | 21 | Apr | 202604 |
| CPB | 2026 | 5 | $21.47 | $19.56 | $20.52 | 0.81% | 20 | May | 202605 |
| CPB | 2026 | 6 | $23.24 | $20.62 | $21.81 | 0.19% | 13 | Jun | 202606 |
| DOW | 2025 | 1 | $39.24 | $34.88 | $37.44 | 0.33% | 20 | Jan | 202501 |
| DOW | 2025 | 2 | $37.30 | $34.11 | $36.03 | 0.63% | 19 | Feb | 202502 |
| DOW | 2025 | 3 | $36.67 | $32.16 | $34.49 | 0.21% | 21 | Mar | 202503 |
| DOW | 2025 | 4 | $33.33 | $23.75 | $27.86 | 0.55% | 21 | Apr | 202504 |
| DOW | 2025 | 5 | $30.70 | $26.45 | $27.89 | 0.12% | 21 | May | 202505 |
| DOW | 2025 | 6 | $30.29 | $25.62 | $27.63 | 0.02% | 20 | Jun | 202506 |
| DOW | 2025 | 7 | $30.04 | $22.28 | $26.91 | 0.04% | 22 | Jul | 202507 |
| DOW | 2025 | 8 | $24.53 | $19.82 | $22.47 | 0.95% | 21 | Aug | 202508 |
| DOW | 2025 | 9 | $25.39 | $21.84 | $23.45 | 0.21% | 21 | Sep | 202509 |
| DOW | 2025 | 10 | $25.67 | $20.35 | $22.67 | 0.59% | 23 | Oct | 202510 |
| DOW | 2025 | 11 | $24.02 | $20.62 | $22.17 | 0.95% | 19 | Nov | 202511 |
| DOW | 2025 | 12 | $25.05 | $22.52 | $23.41 | 0.34% | 22 | Dec | 202512 |
| DOW | 2026 | 1 | $29.09 | $23.31 | $26.93 | 0.73% | 20 | Jan | 202601 |
| DOW | 2026 | 2 | $34.77 | $27.10 | $31.36 | 0.47% | 19 | Feb | 202602 |
| DOW | 2026 | 3 | $42.74 | $29.39 | $36.36 | 0.92% | 22 | Mar | 202603 |
| DOW | 2026 | 4 | $42.35 | $34.80 | $39.11 | 0.75% | 21 | Apr | 202604 |
| DOW | 2026 | 5 | $41.47 | $33.44 | $37.53 | 0.04% | 20 | May | 202605 |
| DOW | 2026 | 6 | $35.80 | $31.91 | $33.95 | 0.15% | 13 | Jun | 202606 |
| EQT | 2025 | 1 | $54.20 | $45.37 | $50.10 | 0.58% | 20 | Jan | 202501 |
| EQT | 2025 | 2 | $56.15 | $45.79 | $50.99 | 0.19% | 19 | Feb | 202502 |
| EQT | 2025 | 3 | $54.85 | $44.78 | $50.57 | 0.81% | 21 | Mar | 202503 |
| EQT | 2025 | 4 | $54.76 | $43.18 | $49.47 | 0.50% | 21 | Apr | 202504 |
| EQT | 2025 | 5 | $57.03 | $48.49 | $54.51 | 0.74% | 21 | May | 202505 |
| EQT | 2025 | 6 | $60.65 | $53.08 | $56.91 | 0.65% | 20 | Jun | 202506 |
| EQT | 2025 | 7 | $59.95 | $50.76 | $54.88 | 0.29% | 22 | Jul | 202507 |
| EQT | 2025 | 8 | $53.22 | $49.25 | $51.53 | 0.61% | 21 | Aug | 202508 |
| EQT | 2025 | 9 | $55.15 | $48.33 | $51.31 | 0.87% | 21 | Sep | 202509 |
| EQT | 2025 | 10 | $57.38 | $50.76 | $54.32 | 0.40% | 23 | Oct | 202510 |
| EQT | 2025 | 11 | $61.26 | $53.27 | $58.23 | 0.95% | 19 | Nov | 202511 |
| EQT | 2025 | 12 | $62.23 | $52.74 | $56.19 | 0.09% | 22 | Dec | 202512 |
| EQT | 2026 | 1 | $58.28 | $49.26 | $53.49 | 0.94% | 20 | Jan | 202601 |
| EQT | 2026 | 2 | $61.77 | $54.01 | $57.73 | 0.95% | 19 | Feb | 202602 |
| EQT | 2026 | 3 | $68.24 | $60.12 | $63.99 | 0.43% | 22 | Mar | 202603 |
| EQT | 2026 | 4 | $63.24 | $56.26 | $58.82 | 0.52% | 21 | Apr | 202604 |
| EQT | 2026 | 5 | $60.03 | $54.53 | $56.94 | 0.07% | 20 | May | 202605 |
| EQT | 2026 | 6 | $55.72 | $50.25 | $52.93 | 0.16% | 13 | Jun | 202606 |
| EXE | 2025 | 1 | $106.12 | $96.04 | $100.46 | 0.24% | 20 | Jan | 202501 |
| EXE | 2025 | 2 | $105.73 | $93.96 | $100.72 | 0.16% | 19 | Feb | 202502 |
| EXE | 2025 | 3 | $109.44 | $90.25 | $101.78 | 0.95% | 21 | Mar | 202503 |
| EXE | 2025 | 4 | $111.19 | $92.98 | $102.19 | 0.46% | 21 | Apr | 202504 |
| EXE | 2025 | 5 | $115.32 | $98.71 | $109.93 | 0.91% | 21 | May | 202505 |
| EXE | 2025 | 6 | $120.89 | $109.08 | $115.47 | 0.47% | 20 | Jun | 202506 |
| EXE | 2025 | 7 | $114.33 | $93.71 | $102.72 | 0.44% | 22 | Jul | 202507 |
| EXE | 2025 | 8 | $102.31 | $90.58 | $95.84 | 0.49% | 21 | Aug | 202508 |
| EXE | 2025 | 9 | $107.84 | $93.57 | $98.60 | 0.85% | 21 | Sep | 202509 |
| EXE | 2025 | 10 | $109.83 | $97.10 | $103.80 | 0.45% | 23 | Oct | 202510 |
| EXE | 2025 | 11 | $122.70 | $102.53 | $115.33 | 0.96% | 19 | Nov | 202511 |
| EXE | 2025 | 12 | $126.62 | $106.00 | $113.75 | 0.21% | 22 | Dec | 202512 |
| EXE | 2026 | 1 | $114.23 | $98.60 | $106.38 | 0.88% | 20 | Jan | 202601 |
| EXE | 2026 | 2 | $112.28 | $98.35 | $105.34 | 0.69% | 19 | Feb | 202602 |
| EXE | 2026 | 3 | $114.81 | $103.67 | $108.35 | 0.55% | 22 | Mar | 202603 |
| EXE | 2026 | 4 | $109.59 | $93.75 | $98.67 | 0.53% | 21 | Apr | 202604 |
| EXE | 2026 | 5 | $101.83 | $92.05 | $97.03 | 0.10% | 20 | May | 202605 |
| EXE | 2026 | 6 | $94.33 | $86.80 | $89.81 | 0.09% | 13 | Jun | 202606 |
| F | 2025 | 1 | $9.73 | $8.87 | $9.30 | 0.60% | 20 | Jan | 202501 |
| F | 2025 | 2 | $9.61 | $8.47 | $8.93 | 0.62% | 19 | Feb | 202502 |
| F | 2025 | 3 | $10.00 | $8.71 | $9.46 | 0.72% | 21 | Mar | 202503 |
| F | 2025 | 4 | $9.87 | $8.11 | $9.27 | 0.86% | 21 | Apr | 202504 |
| F | 2025 | 5 | $10.57 | $9.63 | $10.14 | 0.52% | 21 | May | 202505 |
| F | 2025 | 6 | $10.65 | $9.64 | $10.22 | 0.93% | 20 | Jun | 202506 |
| F | 2025 | 7 | $11.68 | $10.42 | $11.16 | 0.30% | 22 | Jul | 202507 |
| F | 2025 | 8 | $11.85 | $10.42 | $11.26 | 0.85% | 21 | Aug | 202508 |
| F | 2025 | 9 | $12.18 | $11.18 | $11.57 | 0.64% | 21 | Sep | 202509 |
| F | 2025 | 10 | $13.81 | $11.21 | $12.21 | 0.68% | 23 | Oct | 202510 |
| F | 2025 | 11 | $13.50 | $12.38 | $13.04 | 0.80% | 19 | Nov | 202511 |
| F | 2025 | 12 | $13.99 | $12.87 | $13.31 | 0.22% | 22 | Dec | 202512 |
| F | 2026 | 1 | $14.50 | $13.06 | $13.78 | 0.57% | 20 | Jan | 202601 |
| F | 2026 | 2 | $14.80 | $13.52 | $13.92 | 0.45% | 19 | Feb | 202602 |
| F | 2026 | 3 | $13.93 | $11.11 | $11.97 | 0.15% | 22 | Mar | 202603 |
| F | 2026 | 4 | $13.04 | $11.35 | $12.30 | 0.43% | 21 | Apr | 202604 |
| F | 2026 | 5 | $17.78 | $11.46 | $13.52 | 0.95% | 20 | May | 202605 |
| F | 2026 | 6 | $17.48 | $13.93 | $15.05 | 0.01% | 13 | Jun | 202606 |
| FANG | 2025 | 1 | $175.92 | $159.41 | $168.74 | 0.02% | 20 | Jan | 202501 |
| FANG | 2025 | 2 | $162.96 | $146.83 | $154.32 | 0.48% | 19 | Feb | 202502 |
| FANG | 2025 | 3 | $161.70 | $134.25 | $148.59 | 0.81% | 21 | Mar | 202503 |
| FANG | 2025 | 4 | $158.42 | $111.64 | $131.70 | 0.38% | 21 | Apr | 202504 |
| FANG | 2025 | 5 | $144.68 | $125.10 | $135.24 | 0.39% | 21 | May | 202505 |
| FANG | 2025 | 6 | $155.80 | $133.97 | $141.81 | 0.07% | 20 | Jun | 202506 |
| FANG | 2025 | 7 | $150.92 | $132.78 | $141.22 | 0.76% | 22 | Jul | 202507 |
| FANG | 2025 | 8 | $149.09 | $134.30 | $141.22 | 0.91% | 21 | Aug | 202508 |
| FANG | 2025 | 9 | $149.97 | $133.38 | $140.09 | 0.53% | 21 | Sep | 202509 |
| FANG | 2025 | 10 | $151.45 | $136.31 | $142.59 | 0.39% | 23 | Oct | 202510 |
| FANG | 2025 | 11 | $154.49 | $136.09 | $145.32 | 0.90% | 19 | Nov | 202511 |
| FANG | 2025 | 12 | $164.44 | $144.80 | $153.21 | 0.28% | 22 | Dec | 202512 |
| FANG | 2026 | 1 | $168.48 | $139.41 | $152.07 | 0.84% | 20 | Jan | 202601 |
| FANG | 2026 | 2 | $177.25 | $156.77 | $168.80 | 0.85% | 19 | Feb | 202602 |
| FANG | 2026 | 3 | $204.90 | $172.55 | $187.16 | 0.78% | 22 | Mar | 202603 |
| FANG | 2026 | 4 | $206.90 | $170.55 | $191.84 | 0.97% | 21 | Apr | 202604 |
| FANG | 2026 | 5 | $214.51 | $186.55 | $199.70 | 0.18% | 20 | May | 202605 |
| FANG | 2026 | 6 | $211.69 | $182.30 | $195.68 | 0.11% | 13 | Jun | 202606 |
| GEV | 2025 | 1 | $446.45 | $316.95 | $378.63 | 0.43% | 20 | Jan | 202501 |
| GEV | 2025 | 2 | $388.97 | $297.30 | $355.52 | 0.40% | 19 | Feb | 202502 |
| GEV | 2025 | 3 | $348.80 | $265.84 | $311.71 | 0.47% | 21 | Mar | 202503 |
| GEV | 2025 | 4 | $379.36 | $251.66 | $326.47 | 0.93% | 21 | Apr | 202504 |
| GEV | 2025 | 5 | $488.35 | $377.87 | $432.28 | 0.85% | 21 | May | 202505 |
| GEV | 2025 | 6 | $531.74 | $457.92 | $491.88 | 0.95% | 20 | Jun | 202506 |
| GEV | 2025 | 7 | $676.51 | $481.43 | $573.35 | 0.91% | 22 | Jul | 202507 |
| GEV | 2025 | 8 | $674.19 | $580.56 | $630.76 | 0.34% | 21 | Aug | 202508 |
| GEV | 2025 | 9 | $652.75 | $564.78 | $612.63 | 0.56% | 21 | Sep | 202509 |
| GEV | 2025 | 10 | $663.93 | $532.33 | $600.24 | 0.40% | 23 | Oct | 202510 |
| GEV | 2025 | 11 | $627.55 | $529.77 | $571.46 | 0.71% | 19 | Nov | 202511 |
| GEV | 2025 | 12 | $730.46 | $574.38 | $649.39 | 0.50% | 22 | Dec | 202512 |
| GEV | 2026 | 1 | $752.02 | $617.11 | $670.28 | 0.81% | 20 | Jan | 202601 |
| GEV | 2026 | 2 | $894.93 | $709.00 | $814.32 | 0.89% | 19 | Feb | 202602 |
| GEV | 2026 | 3 | $948.38 | $777.00 | $850.61 | 0.56% | 22 | Mar | 202603 |
| GEV | 2026 | 4 | $1,181.95 | $866.00 | $1,009.81 | 0.69% | 21 | Apr | 202604 |
| GEV | 2026 | 5 | $1,125.43 | $952.01 | $1,049.10 | 0.09% | 20 | May | 202605 |
| GEV | 2026 | 6 | $1,065.38 | $856.05 | $950.37 | 0.92% | 13 | Jun | 202606 |
| GL | 2025 | 1 | $123.26 | $109.40 | $115.94 | 0.84% | 20 | Jan | 202501 |
| GL | 2025 | 2 | $126.78 | $116.17 | $121.97 | 0.96% | 19 | Feb | 202502 |
| GL | 2025 | 3 | $131.42 | $120.12 | $125.93 | 0.93% | 21 | Mar | 202503 |
| GL | 2025 | 4 | $132.67 | $108.71 | $121.33 | 0.58% | 21 | Apr | 202504 |
| GL | 2025 | 5 | $123.46 | $110.45 | $120.07 | 0.82% | 21 | May | 202505 |
| GL | 2025 | 6 | $123.80 | $117.62 | $120.55 | 0.96% | 20 | Jun | 202506 |
| GL | 2025 | 7 | $143.44 | $116.28 | $124.90 | 0.87% | 22 | Jul | 202507 |
| GL | 2025 | 8 | $141.66 | $134.26 | $138.64 | 0.70% | 21 | Aug | 202508 |
| GL | 2025 | 9 | $147.26 | $137.36 | $141.86 | 0.51% | 21 | Sep | 202509 |
| GL | 2025 | 10 | $141.90 | $130.71 | $135.38 | 0.05% | 23 | Oct | 202510 |
| GL | 2025 | 11 | $136.18 | $127.60 | $132.42 | 0.80% | 19 | Nov | 202511 |
| GL | 2025 | 12 | $144.16 | $128.96 | $137.38 | 0.70% | 22 | Dec | 202512 |
| GL | 2026 | 1 | $144.26 | $135.42 | $139.67 | 0.54% | 20 | Jan | 202601 |
| GL | 2026 | 2 | $152.71 | $139.13 | $144.18 | 0.45% | 19 | Feb | 202602 |
| GL | 2026 | 3 | $147.18 | $135.07 | $139.96 | 0.34% | 22 | Mar | 202603 |
| GL | 2026 | 4 | $155.08 | $138.93 | $149.00 | 0.95% | 21 | Apr | 202604 |
| GL | 2026 | 5 | $157.92 | $148.50 | $154.07 | 0.50% | 20 | May | 202605 |
| GL | 2026 | 6 | $171.75 | $148.34 | $160.50 | 0.98% | 13 | Jun | 202606 |
| HLT | 2025 | 1 | $257.72 | $238.17 | $246.82 | 0.89% | 20 | Jan | 202501 |
| HLT | 2025 | 2 | $274.59 | $250.09 | $263.91 | 0.59% | 19 | Feb | 202502 |
| HLT | 2025 | 3 | $267.43 | $218.83 | $236.47 | 0.17% | 21 | Mar | 202503 |
| HLT | 2025 | 4 | $231.64 | $195.70 | $214.65 | 0.82% | 21 | Apr | 202504 |
| HLT | 2025 | 5 | $259.11 | $226.52 | $247.07 | 0.66% | 21 | May | 202505 |
| HLT | 2025 | 6 | $266.39 | $241.18 | $252.05 | 0.99% | 20 | Jun | 202506 |
| HLT | 2025 | 7 | $279.15 | $263.71 | $272.09 | 0.26% | 22 | Jul | 202507 |
| HLT | 2025 | 8 | $278.33 | $257.21 | $268.47 | 0.89% | 21 | Aug | 202508 |
| HLT | 2025 | 9 | $279.65 | $257.74 | $269.60 | 0.07% | 21 | Sep | 202509 |
| HLT | 2025 | 10 | $279.44 | $254.13 | $262.00 | 0.11% | 23 | Oct | 202510 |
| HLT | 2025 | 11 | $287.40 | $253.40 | $271.10 | 0.93% | 19 | Nov | 202511 |
| HLT | 2025 | 12 | $294.92 | $267.19 | $283.83 | 0.72% | 22 | Dec | 202512 |
| HLT | 2026 | 1 | $306.28 | $285.11 | $296.80 | 0.63% | 20 | Jan | 202601 |
| HLT | 2026 | 2 | $333.86 | $298.95 | $314.16 | 0.37% | 19 | Feb | 202602 |
| HLT | 2026 | 3 | $309.50 | $289.52 | $299.45 | 0.73% | 22 | Mar | 202603 |
| HLT | 2026 | 4 | $344.75 | $299.15 | $325.02 | 0.55% | 21 | Apr | 202604 |
| HLT | 2026 | 5 | $338.28 | $308.06 | $320.06 | 0.65% | 20 | May | 202605 |
| HLT | 2026 | 6 | $358.00 | $323.24 | $341.08 | 0.75% | 13 | Jun | 202606 |
| HPQ | 2025 | 1 | $32.99 | $30.85 | $31.55 | 0.13% | 20 | Jan | 202501 |
| HPQ | 2025 | 2 | $33.78 | $28.71 | $31.86 | 0.17% | 19 | Feb | 202502 |
| HPQ | 2025 | 3 | $30.10 | $26.41 | $27.87 | 0.10% | 21 | Mar | 202503 |
| HPQ | 2025 | 4 | $27.15 | $20.52 | $23.61 | 0.64% | 21 | Apr | 202504 |
| HPQ | 2025 | 5 | $28.52 | $22.82 | $26.43 | 0.22% | 21 | May | 202505 |
| HPQ | 2025 | 6 | $24.91 | $22.94 | $24.04 | 0.50% | 20 | Jun | 202506 |
| HPQ | 2025 | 7 | $25.70 | $23.59 | $24.81 | 0.32% | 22 | Jul | 202507 |
| HPQ | 2025 | 8 | $28.30 | $23.59 | $25.95 | 0.92% | 21 | Aug | 202508 |
| HPQ | 2025 | 9 | $28.91 | $26.01 | $27.72 | 0.31% | 21 | Sep | 202509 |
| HPQ | 2025 | 10 | $28.65 | $25.16 | $27.04 | 0.63% | 23 | Oct | 202510 |
| HPQ | 2025 | 11 | $27.47 | $22.01 | $24.37 | 0.39% | 19 | Nov | 202511 |
| HPQ | 2025 | 12 | $25.73 | $22.27 | $24.14 | 0.00% | 22 | Dec | 202512 |
| HPQ | 2026 | 1 | $22.60 | $18.94 | $20.46 | 0.14% | 20 | Jan | 202601 |
| HPQ | 2026 | 2 | $20.55 | $17.56 | $18.99 | 0.48% | 19 | Feb | 202602 |
| HPQ | 2026 | 3 | $20.14 | $18.01 | $18.91 | 0.56% | 22 | Mar | 202603 |
| HPQ | 2026 | 4 | $21.42 | $18.13 | $19.53 | 0.83% | 21 | Apr | 202604 |
| HPQ | 2026 | 5 | $28.17 | $20.37 | $22.28 | 0.86% | 20 | May | 202605 |
| HPQ | 2026 | 6 | $29.65 | $23.17 | $25.50 | 0.00% | 13 | Jun | 202606 |
| HSY | 2025 | 1 | $165.84 | $142.91 | $151.10 | 0.07% | 20 | Jan | 202501 |
| HSY | 2025 | 2 | $177.66 | $135.68 | $157.39 | 0.79% | 19 | Feb | 202502 |
| HSY | 2025 | 3 | $188.86 | $159.96 | $168.72 | 0.24% | 21 | Mar | 202503 |
| HSY | 2025 | 4 | $168.17 | $153.38 | $161.39 | 0.67% | 21 | Apr | 202504 |
| HSY | 2025 | 5 | $167.43 | $147.76 | $158.75 | 0.53% | 21 | May | 202505 |
| HSY | 2025 | 6 | $171.55 | $155.37 | $164.88 | 0.50% | 20 | Jun | 202506 |
| HSY | 2025 | 7 | $195.98 | $157.64 | $172.76 | 0.67% | 22 | Jul | 202507 |
| HSY | 2025 | 8 | $189.74 | $171.33 | $180.32 | 0.60% | 21 | Aug | 202508 |
| HSY | 2025 | 9 | $193.86 | $181.39 | $186.21 | 0.34% | 21 | Sep | 202509 |
| HSY | 2025 | 10 | $195.61 | $161.84 | $184.79 | 0.19% | 23 | Oct | 202510 |
| HSY | 2025 | 11 | $189.49 | $160.20 | $176.97 | 0.95% | 19 | Nov | 202511 |
| HSY | 2025 | 12 | $191.15 | $175.57 | $183.72 | 0.41% | 22 | Dec | 202512 |
| HSY | 2026 | 1 | $201.86 | $178.65 | $190.88 | 0.69% | 20 | Jan | 202601 |
| HSY | 2026 | 2 | $236.77 | $193.70 | $223.01 | 0.99% | 19 | Feb | 202602 |
| HSY | 2026 | 3 | $239.48 | $205.54 | $218.63 | 0.07% | 22 | Mar | 202603 |
| HSY | 2026 | 4 | $211.09 | $181.45 | $196.14 | 0.14% | 21 | Apr | 202604 |
| HSY | 2026 | 5 | $200.00 | $180.18 | $190.17 | 0.70% | 20 | May | 202605 |
| HSY | 2026 | 6 | $193.00 | $172.46 | $180.83 | 0.14% | 13 | Jun | 202606 |
| HWM | 2025 | 1 | $128.76 | $109.21 | $120.52 | 0.87% | 20 | Jan | 202501 |
| HWM | 2025 | 2 | $140.29 | $122.49 | $130.76 | 0.78% | 19 | Feb | 202502 |
| HWM | 2025 | 3 | $138.99 | $118.81 | $129.00 | 0.53% | 21 | Mar | 202503 |
| HWM | 2025 | 4 | $139.35 | $104.84 | $126.69 | 0.97% | 21 | Apr | 202504 |
| HWM | 2025 | 5 | $171.31 | $144.44 | $160.97 | 0.94% | 21 | May | 202505 |
| HWM | 2025 | 6 | $187.28 | $165.30 | $174.18 | 0.94% | 20 | Jun | 202506 |
| HWM | 2025 | 7 | $193.02 | $171.57 | $183.79 | 0.37% | 22 | Jul | 202507 |
| HWM | 2025 | 8 | $186.32 | $169.35 | $176.45 | 0.27% | 21 | Aug | 202508 |
| HWM | 2025 | 9 | $196.55 | $170.71 | $186.03 | 0.98% | 21 | Sep | 202509 |
| HWM | 2025 | 10 | $211.83 | $183.72 | $194.32 | 0.79% | 23 | Oct | 202510 |
| HWM | 2025 | 11 | $211.78 | $192.76 | $203.69 | 0.62% | 19 | Nov | 202511 |
| HWM | 2025 | 12 | $212.52 | $188.83 | $199.85 | 0.68% | 22 | Dec | 202512 |
| HWM | 2026 | 1 | $226.87 | $204.15 | $216.22 | 0.17% | 20 | Jan | 202601 |
| HWM | 2026 | 2 | $262.62 | $204.55 | $239.44 | 1.00% | 19 | Feb | 202602 |
| HWM | 2026 | 3 | $267.31 | $220.51 | $242.86 | 0.21% | 22 | Mar | 202603 |
| HWM | 2026 | 4 | $259.82 | $230.97 | $246.02 | 0.41% | 21 | Apr | 202604 |
| HWM | 2026 | 5 | $280.74 | $237.87 | $259.79 | 0.48% | 20 | May | 202605 |
| HWM | 2026 | 6 | $285.63 | $243.68 | $259.20 | 0.94% | 13 | Jun | 202606 |
| INTU | 2025 | 1 | $632.38 | $582.05 | $607.45 | 0.31% | 20 | Jan | 202501 |
| INTU | 2025 | 2 | $634.68 | $549.51 | $582.35 | 0.71% | 19 | Feb | 202502 |
| INTU | 2025 | 3 | $616.74 | $559.92 | $598.51 | 0.88% | 21 | Mar | 202503 |
| INTU | 2025 | 4 | $626.15 | $529.06 | $590.66 | 0.98% | 21 | Apr | 202504 |
| INTU | 2025 | 5 | $757.21 | $619.30 | $671.55 | 0.95% | 21 | May | 202505 |
| INTU | 2025 | 6 | $786.54 | $744.59 | $761.75 | 0.93% | 20 | Jun | 202506 |
| INTU | 2025 | 7 | $810.72 | $739.67 | $769.30 | 0.60% | 22 | Jul | 202507 |
| INTU | 2025 | 8 | $791.18 | $640.17 | $710.33 | 0.16% | 21 | Aug | 202508 |
| INTU | 2025 | 9 | $702.50 | $637.92 | $672.29 | 0.66% | 21 | Sep | 202509 |
| INTU | 2025 | 10 | $687.90 | $640.05 | $663.73 | 0.55% | 23 | Oct | 202510 |
| INTU | 2025 | 11 | $681.02 | $618.68 | $650.66 | 0.23% | 19 | Nov | 202511 |
| INTU | 2025 | 12 | $679.95 | $622.84 | $662.65 | 0.67% | 22 | Dec | 202512 |
| INTU | 2026 | 1 | $660.77 | $491.72 | $578.79 | 0.04% | 20 | Jan | 202601 |
| INTU | 2026 | 2 | $502.62 | $349.00 | $407.12 | 0.39% | 19 | Feb | 202602 |
| INTU | 2026 | 3 | $483.20 | $401.45 | $444.53 | 0.38% | 22 | Mar | 202603 |
| INTU | 2026 | 4 | $436.59 | $342.11 | $393.14 | 0.49% | 21 | Apr | 202604 |
| INTU | 2026 | 5 | $423.99 | $300.50 | $369.52 | 0.25% | 20 | May | 202605 |
| INTU | 2026 | 6 | $363.18 | $268.01 | $296.54 | 0.01% | 13 | Jun | 202606 |
| JPM | 2025 | 1 | $265.38 | $233.43 | $249.73 | 0.89% | 20 | Jan | 202501 |
| JPM | 2025 | 2 | $274.62 | $248.26 | $264.25 | 0.42% | 19 | Feb | 202502 |
| JPM | 2025 | 3 | $260.97 | $219.72 | $236.73 | 0.50% | 21 | Mar | 202503 |
| JPM | 2025 | 4 | $243.37 | $199.32 | $230.45 | 0.95% | 21 | Apr | 202504 |
| JPM | 2025 | 5 | $265.73 | $238.77 | $255.92 | 0.80% | 21 | May | 202505 |
| JPM | 2025 | 6 | $288.54 | $256.65 | $269.05 | 0.92% | 20 | Jun | 202506 |
| JPM | 2025 | 7 | $298.49 | $277.70 | $288.94 | 0.76% | 22 | Jul | 202507 |
| JPM | 2025 | 8 | $300.13 | $281.59 | $290.46 | 0.92% | 21 | Aug | 202508 |
| JPM | 2025 | 9 | $315.05 | $288.73 | $304.67 | 0.90% | 21 | Sep | 202509 |
| JPM | 2025 | 10 | $311.66 | $289.24 | $302.42 | 0.91% | 23 | Oct | 202510 |
| JPM | 2025 | 11 | $320.80 | $291.50 | $306.25 | 0.69% | 19 | Nov | 202511 |
| JPM | 2025 | 12 | $329.37 | $297.12 | $315.76 | 0.73% | 22 | Dec | 202512 |
| JPM | 2026 | 1 | $335.87 | $296.51 | $313.13 | 0.24% | 20 | Jan | 202601 |
| JPM | 2026 | 2 | $326.40 | $291.39 | $308.88 | 0.25% | 19 | Feb | 202602 |
| JPM | 2026 | 3 | $302.39 | $279.10 | $289.92 | 0.65% | 22 | Mar | 202603 |
| JPM | 2026 | 4 | $320.23 | $288.72 | $308.12 | 0.78% | 21 | Apr | 202604 |
| JPM | 2026 | 5 | $316.30 | $293.67 | $303.27 | 0.25% | 20 | May | 202605 |
| JPM | 2026 | 6 | $337.77 | $295.27 | $313.29 | 0.90% | 13 | Jun | 202606 |
| LULU | 2025 | 1 | $423.32 | $367.15 | $391.95 | 0.84% | 20 | Jan | 202501 |
| LULU | 2025 | 2 | $417.91 | $354.05 | $383.80 | 0.18% | 19 | Feb | 202502 |
| LULU | 2025 | 3 | $367.01 | $280.83 | $327.61 | 0.03% | 21 | Mar | 202503 |
| LULU | 2025 | 4 | $287.95 | $234.84 | $263.44 | 0.68% | 21 | Apr | 202504 |
| LULU | 2025 | 5 | $330.49 | $268.36 | $303.55 | 0.78% | 21 | May | 202505 |
| LULU | 2025 | 6 | $340.25 | $219.97 | $258.59 | 0.15% | 20 | Jun | 202506 |
| LULU | 2025 | 7 | $252.24 | $200.24 | $227.88 | 0.01% | 22 | Jul | 202507 |
| LULU | 2025 | 8 | $208.13 | $185.95 | $198.02 | 0.73% | 21 | Aug | 202508 |
| LULU | 2025 | 9 | $206.64 | $159.25 | $173.93 | 0.39% | 21 | Sep | 202509 |
| LULU | 2025 | 10 | $186.91 | $161.80 | $173.57 | 0.35% | 23 | Oct | 202510 |
| LULU | 2025 | 11 | $186.69 | $160.46 | $169.22 | 0.90% | 19 | Nov | 202511 |
| LULU | 2025 | 12 | $225.98 | $178.90 | $199.39 | 0.61% | 22 | Dec | 202512 |
| LULU | 2026 | 1 | $217.22 | $171.25 | $198.44 | 0.07% | 20 | Jan | 202601 |
| LULU | 2026 | 2 | $192.48 | $168.39 | $178.48 | 0.70% | 19 | Feb | 202602 |
| LULU | 2026 | 3 | $179.38 | $143.96 | $162.50 | 0.26% | 22 | Mar | 202603 |
| LULU | 2026 | 4 | $170.20 | $136.90 | $156.06 | 0.02% | 21 | Apr | 202604 |
| LULU | 2026 | 5 | $139.20 | $116.63 | $127.10 | 0.64% | 20 | May | 202605 |
| LULU | 2026 | 6 | $134.38 | $109.36 | $120.44 | 0.10% | 13 | Jun | 202606 |
| MGM | 2025 | 1 | $35.13 | $31.61 | $33.31 | 0.82% | 20 | Jan | 202501 |
| MGM | 2025 | 2 | $41.32 | $32.67 | $35.91 | 0.24% | 19 | Feb | 202502 |
| MGM | 2025 | 3 | $35.53 | $28.63 | $31.79 | 0.15% | 21 | Mar | 202503 |
| MGM | 2025 | 4 | $32.72 | $25.30 | $29.56 | 0.83% | 21 | Apr | 202504 |
| MGM | 2025 | 5 | $35.10 | $30.21 | $32.55 | 0.29% | 21 | May | 202505 |
| MGM | 2025 | 6 | $34.77 | $30.68 | $33.08 | 0.91% | 20 | Jun | 202506 |
| MGM | 2025 | 7 | $39.29 | $34.59 | $37.67 | 0.40% | 22 | Jul | 202507 |
| MGM | 2025 | 8 | $40.16 | $33.85 | $36.56 | 0.93% | 21 | Aug | 202508 |
| MGM | 2025 | 9 | $39.14 | $34.10 | $35.80 | 0.11% | 21 | Sep | 202509 |
| MGM | 2025 | 10 | $35.55 | $29.19 | $32.52 | 0.45% | 23 | Oct | 202510 |
| MGM | 2025 | 11 | $35.62 | $30.55 | $32.55 | 0.93% | 19 | Nov | 202511 |
| MGM | 2025 | 12 | $38.19 | $34.86 | $36.60 | 0.49% | 22 | Dec | 202512 |
| MGM | 2026 | 1 | $37.29 | $32.14 | $34.47 | 0.27% | 20 | Jan | 202601 |
| MGM | 2026 | 2 | $39.25 | $33.22 | $35.92 | 0.60% | 19 | Feb | 202602 |
| MGM | 2026 | 3 | $37.97 | $33.44 | $36.39 | 0.79% | 22 | Mar | 202603 |
| MGM | 2026 | 4 | $40.94 | $35.32 | $38.28 | 0.64% | 21 | Apr | 202604 |
| MGM | 2026 | 5 | $44.28 | $35.32 | $38.39 | 0.93% | 20 | May | 202605 |
| MGM | 2026 | 6 | $51.59 | $46.16 | $47.99 | 0.14% | 13 | Jun | 202606 |
| MKC | 2025 | 1 | $76.13 | $68.27 | $72.63 | 0.89% | 20 | Jan | 202501 |
| MKC | 2025 | 2 | $81.31 | $73.73 | $76.68 | 0.89% | 19 | Feb | 202502 |
| MKC | 2025 | 3 | $84.04 | $74.17 | $79.65 | 0.61% | 21 | Mar | 202503 |
| MKC | 2025 | 4 | $80.79 | $69.41 | $74.60 | 0.50% | 21 | Apr | 202504 |
| MKC | 2025 | 5 | $75.78 | $68.60 | $72.61 | 0.38% | 21 | May | 202505 |
| MKC | 2025 | 6 | $76.62 | $70.01 | $73.00 | 0.65% | 20 | Jun | 202506 |
| MKC | 2025 | 7 | $76.49 | $69.28 | $71.40 | 0.05% | 22 | Jul | 202507 |
| MKC | 2025 | 8 | $71.58 | $67.29 | $69.12 | 0.49% | 21 | Aug | 202508 |
| MKC | 2025 | 9 | $70.64 | $62.78 | $66.52 | 0.41% | 21 | Sep | 202509 |
| MKC | 2025 | 10 | $68.46 | $62.71 | $65.90 | 0.17% | 23 | Oct | 202510 |
| MKC | 2025 | 11 | $68.40 | $62.75 | $65.32 | 0.75% | 19 | Nov | 202511 |
| MKC | 2025 | 12 | $69.75 | $62.20 | $66.45 | 0.78% | 22 | Dec | 202512 |
| MKC | 2026 | 1 | $68.78 | $59.62 | $65.19 | 0.24% | 20 | Jan | 202601 |
| MKC | 2026 | 2 | $72.41 | $60.15 | $68.47 | 0.89% | 19 | Feb | 202602 |
| MKC | 2026 | 3 | $70.75 | $48.31 | $58.21 | 0.09% | 22 | Mar | 202603 |
| MKC | 2026 | 4 | $54.71 | $47.52 | $51.73 | 0.46% | 21 | Apr | 202604 |
| MKC | 2026 | 5 | $51.30 | $44.82 | $47.39 | 0.39% | 20 | May | 202605 |
| MKC | 2026 | 6 | $50.15 | $45.53 | $47.58 | 0.21% | 13 | Jun | 202606 |
| MSTR | 2025 | 1 | $404.42 | $292.32 | $350.38 | 0.38% | 20 | Jan | 202501 |
| MSTR | 2025 | 2 | $353.79 | $231.92 | $310.37 | 0.19% | 19 | Feb | 202502 |
| MSTR | 2025 | 3 | $343.59 | $231.51 | $292.66 | 0.51% | 21 | Mar | 202503 |
| MSTR | 2025 | 4 | $384.00 | $235.93 | $317.96 | 0.97% | 21 | Apr | 202504 |
| MSTR | 2025 | 5 | $430.35 | $358.50 | $394.72 | 0.15% | 21 | May | 202505 |
| MSTR | 2025 | 6 | $407.39 | $358.80 | $380.88 | 0.93% | 20 | Jun | 202506 |
| MSTR | 2025 | 7 | $457.22 | $372.91 | $415.87 | 0.34% | 22 | Jul | 202507 |
| MSTR | 2025 | 8 | $414.36 | $325.56 | $365.99 | 0.10% | 21 | Aug | 202508 |
| MSTR | 2025 | 9 | $358.25 | $292.36 | $329.03 | 0.45% | 21 | Sep | 202509 |
| MSTR | 2025 | 10 | $365.21 | $254.00 | $304.61 | 0.14% | 23 | Oct | 202510 |
| MSTR | 2025 | 11 | $270.36 | $166.01 | $209.96 | 0.11% | 19 | Nov | 202511 |
| MSTR | 2025 | 12 | $198.40 | $151.42 | $169.95 | 0.01% | 22 | Dec | 202512 |
| MSTR | 2026 | 1 | $190.20 | $139.36 | $162.34 | 0.20% | 20 | Jan | 202601 |
| MSTR | 2026 | 2 | $147.88 | $104.17 | $129.45 | 0.58% | 19 | Feb | 202602 |
| MSTR | 2026 | 3 | $152.27 | $117.76 | $137.00 | 0.20% | 22 | Mar | 202603 |
| MSTR | 2026 | 4 | $183.25 | $116.40 | $148.80 | 0.73% | 21 | Apr | 202604 |
| MSTR | 2026 | 5 | $197.00 | $144.30 | $173.58 | 0.28% | 20 | May | 202605 |
| MSTR | 2026 | 6 | $153.87 | $113.27 | $125.88 | 0.08% | 13 | Jun | 202606 |
| MU | 2025 | 1 | $110.31 | $84.46 | $97.67 | 0.25% | 20 | Jan | 202501 |
| MU | 2025 | 2 | $107.53 | $87.06 | $95.63 | 0.31% | 19 | Feb | 202502 |
| MU | 2025 | 3 | $104.35 | $83.93 | $93.99 | 0.14% | 21 | Mar | 202503 |
| MU | 2025 | 4 | $89.75 | $61.42 | $73.54 | 0.54% | 21 | Apr | 202504 |
| MU | 2025 | 5 | $99.43 | $77.49 | $91.04 | 0.76% | 21 | May | 202505 |
| MU | 2025 | 6 | $129.59 | $94.21 | $116.18 | 0.81% | 20 | Jun | 202506 |
| MU | 2025 | 7 | $126.02 | $106.83 | $116.42 | 0.11% | 22 | Jul | 202507 |
| MU | 2025 | 8 | $128.47 | $103.27 | $117.55 | 0.62% | 21 | Aug | 202508 |
| MU | 2025 | 9 | $170.27 | $114.13 | $150.01 | 0.94% | 21 | Sep | 202509 |
| MU | 2025 | 10 | $232.31 | $165.33 | $201.09 | 0.87% | 23 | Oct | 202510 |
| MU | 2025 | 11 | $260.47 | $192.51 | $232.01 | 0.65% | 19 | Nov | 202511 |
| MU | 2025 | 12 | $298.83 | $221.60 | $256.61 | 0.83% | 22 | Dec | 202512 |
| MU | 2026 | 1 | $455.48 | $294.86 | $366.80 | 0.75% | 20 | Jan | 202601 |
| MU | 2026 | 2 | $442.43 | $363.90 | $408.90 | 0.62% | 19 | Feb | 202602 |
| MU | 2026 | 3 | $471.34 | $311.49 | $399.53 | 0.16% | 22 | Mar | 202603 |
| MU | 2026 | 4 | $535.50 | $340.20 | $448.91 | 0.91% | 21 | Apr | 202604 |
| MU | 2026 | 5 | $981.00 | $510.21 | $751.46 | 0.98% | 20 | May | 202605 |
| MU | 2026 | 6 | $1,110.40 | $854.35 | $995.82 | 0.74% | 13 | Jun | 202606 |
| NCLH | 2025 | 1 | $29.29 | $24.48 | $26.58 | 0.80% | 20 | Jan | 202501 |
| NCLH | 2025 | 2 | $28.91 | $22.28 | $26.10 | 0.07% | 19 | Feb | 202502 |
| NCLH | 2025 | 3 | $23.28 | $17.70 | $19.88 | 0.23% | 21 | Mar | 202503 |
| NCLH | 2025 | 4 | $19.59 | $14.21 | $16.81 | 0.34% | 21 | Apr | 202504 |
| NCLH | 2025 | 5 | $19.68 | $16.05 | $17.97 | 0.44% | 21 | May | 202505 |
| NCLH | 2025 | 6 | $20.44 | $17.20 | $18.95 | 0.95% | 20 | Jun | 202506 |
| NCLH | 2025 | 7 | $27.10 | $20.08 | $23.00 | 0.78% | 22 | Jul | 202507 |
| NCLH | 2025 | 8 | $25.59 | $23.13 | $24.54 | 0.70% | 21 | Aug | 202508 |
| NCLH | 2025 | 9 | $27.18 | $23.95 | $25.40 | 0.21% | 21 | Sep | 202509 |
| NCLH | 2025 | 10 | $24.94 | $21.84 | $23.35 | 0.19% | 23 | Oct | 202510 |
| NCLH | 2025 | 11 | $22.46 | $17.35 | $18.54 | 0.22% | 19 | Nov | 202511 |
| NCLH | 2025 | 12 | $24.32 | $18.12 | $21.00 | 0.68% | 22 | Dec | 202512 |
| NCLH | 2026 | 1 | $25.13 | $20.33 | $22.45 | 0.34% | 20 | Jan | 202601 |
| NCLH | 2026 | 2 | $25.10 | $21.07 | $23.43 | 0.92% | 19 | Feb | 202602 |
| NCLH | 2026 | 3 | $22.88 | $17.56 | $19.93 | 0.21% | 22 | Mar | 202603 |
| NCLH | 2026 | 4 | $22.22 | $17.28 | $19.40 | 0.18% | 21 | Apr | 202604 |
| NCLH | 2026 | 5 | $19.12 | $14.53 | $16.79 | 0.83% | 20 | May | 202605 |
| NCLH | 2026 | 6 | $20.81 | $17.69 | $18.96 | 0.69% | 13 | Jun | 202606 |
| ON | 2025 | 1 | $67.00 | $51.81 | $56.46 | 0.03% | 20 | Jan | 202501 |
| ON | 2025 | 2 | $57.77 | $46.04 | $51.10 | 0.09% | 19 | Feb | 202502 |
| ON | 2025 | 3 | $48.01 | $39.36 | $43.80 | 0.15% | 21 | Mar | 202503 |
| ON | 2025 | 4 | $41.59 | $31.04 | $36.75 | 0.82% | 21 | Apr | 202504 |
| ON | 2025 | 5 | $46.59 | $37.19 | $42.36 | 0.51% | 21 | May | 202505 |
| ON | 2025 | 6 | $55.01 | $41.49 | $51.69 | 0.81% | 20 | Jun | 202506 |
| ON | 2025 | 7 | $63.63 | $51.53 | $58.16 | 0.40% | 22 | Jul | 202507 |
| ON | 2025 | 8 | $57.41 | $46.35 | $50.00 | 0.29% | 21 | Aug | 202508 |
| ON | 2025 | 9 | $52.82 | $46.50 | $49.48 | 0.44% | 21 | Sep | 202509 |
| ON | 2025 | 10 | $55.99 | $45.64 | $50.79 | 0.43% | 23 | Oct | 202510 |
| ON | 2025 | 11 | $52.26 | $44.56 | $47.98 | 0.74% | 19 | Nov | 202511 |
| ON | 2025 | 12 | $57.52 | $49.13 | $54.69 | 0.60% | 22 | Dec | 202512 |
| ON | 2026 | 1 | $66.86 | $55.17 | $61.02 | 0.40% | 20 | Jan | 202601 |
| ON | 2026 | 2 | $73.76 | $57.60 | $67.45 | 0.55% | 19 | Feb | 202602 |
| ON | 2026 | 3 | $66.48 | $54.99 | $60.29 | 0.60% | 22 | Mar | 202603 |
| ON | 2026 | 4 | $101.69 | $59.72 | $80.20 | 0.98% | 21 | Apr | 202604 |
| ON | 2026 | 5 | $129.13 | $96.08 | $111.18 | 0.74% | 20 | May | 202605 |
| ON | 2026 | 6 | $134.92 | $108.30 | $120.80 | 0.17% | 13 | Jun | 202606 |
| PCG | 2025 | 1 | $20.27 | $15.20 | $17.15 | 0.06% | 20 | Jan | 202501 |
| PCG | 2025 | 2 | $16.34 | $14.87 | $15.59 | 0.91% | 19 | Feb | 202502 |
| PCG | 2025 | 3 | $17.24 | $15.45 | $16.57 | 0.90% | 21 | Mar | 202503 |
| PCG | 2025 | 4 | $17.66 | $15.37 | $16.88 | 0.45% | 21 | Apr | 202504 |
| PCG | 2025 | 5 | $17.83 | $16.48 | $17.05 | 0.21% | 21 | May | 202505 |
| PCG | 2025 | 6 | $16.69 | $13.25 | $14.47 | 0.18% | 20 | Jun | 202506 |
| PCG | 2025 | 7 | $14.20 | $12.91 | $13.61 | 0.81% | 22 | Jul | 202507 |
| PCG | 2025 | 8 | $15.69 | $13.72 | $15.02 | 0.75% | 21 | Aug | 202508 |
| PCG | 2025 | 9 | $16.01 | $14.27 | $14.97 | 0.44% | 21 | Sep | 202509 |
| PCG | 2025 | 10 | $17.02 | $15.08 | $16.17 | 0.43% | 23 | Oct | 202510 |
| PCG | 2025 | 11 | $16.80 | $15.48 | $16.15 | 0.45% | 19 | Nov | 202511 |
| PCG | 2025 | 12 | $16.15 | $14.70 | $15.47 | 0.94% | 22 | Dec | 202512 |
| PCG | 2026 | 1 | $16.38 | $14.77 | $15.52 | 0.40% | 20 | Jan | 202601 |
| PCG | 2026 | 2 | $19.08 | $15.03 | $17.44 | 0.98% | 19 | Feb | 202602 |
| PCG | 2026 | 3 | $19.16 | $17.00 | $18.01 | 0.27% | 22 | Mar | 202603 |
| PCG | 2026 | 4 | $18.92 | $16.10 | $17.33 | 0.18% | 21 | Apr | 202604 |
| PCG | 2026 | 5 | $16.92 | $15.27 | $16.35 | 0.65% | 20 | May | 202605 |
| PCG | 2026 | 6 | $17.25 | $16.13 | $16.68 | 0.28% | 13 | Jun | 202606 |
| RJF | 2025 | 1 | $172.04 | $150.68 | $162.14 | 0.73% | 20 | Jan | 202501 |
| RJF | 2025 | 2 | $168.15 | $146.03 | $157.20 | 0.30% | 19 | Feb | 202502 |
| RJF | 2025 | 3 | $153.96 | $133.32 | $141.06 | 0.18% | 21 | Mar | 202503 |
| RJF | 2025 | 4 | $141.05 | $116.45 | $132.67 | 0.78% | 21 | Apr | 202504 |
| RJF | 2025 | 5 | $153.30 | $135.11 | $146.04 | 0.58% | 21 | May | 202505 |
| RJF | 2025 | 6 | $153.05 | $140.83 | $147.04 | 0.91% | 20 | Jun | 202506 |
| RJF | 2025 | 7 | $169.81 | $150.75 | $160.13 | 0.80% | 22 | Jul | 202507 |
| RJF | 2025 | 8 | $168.67 | $159.11 | $164.40 | 0.97% | 21 | Aug | 202508 |
| RJF | 2025 | 9 | $176.55 | $162.19 | $169.69 | 0.65% | 21 | Sep | 202509 |
| RJF | 2025 | 10 | $172.42 | $156.22 | $162.52 | 0.12% | 23 | Oct | 202510 |
| RJF | 2025 | 11 | $167.38 | $150.18 | $157.62 | 0.34% | 19 | Nov | 202511 |
| RJF | 2025 | 12 | $167.12 | $154.64 | $162.13 | 0.43% | 22 | Dec | 202512 |
| RJF | 2026 | 1 | $174.70 | $159.64 | $168.68 | 0.41% | 20 | Jan | 202601 |
| RJF | 2026 | 2 | $174.14 | $151.44 | $161.32 | 0.07% | 19 | Feb | 202602 |
| RJF | 2026 | 3 | $157.00 | $139.51 | $147.12 | 0.30% | 22 | Mar | 202603 |
| RJF | 2026 | 4 | $158.76 | $138.82 | $150.76 | 0.98% | 21 | Apr | 202604 |
| RJF | 2026 | 5 | $161.08 | $141.06 | $152.48 | 0.12% | 20 | May | 202605 |
| RJF | 2026 | 6 | $160.15 | $142.05 | $151.53 | 0.92% | 13 | Jun | 202606 |
| ROK | 2025 | 1 | $288.27 | $265.21 | $277.33 | 0.38% | 20 | Jan | 202501 |
| ROK | 2025 | 2 | $303.74 | $261.89 | $284.86 | 0.52% | 19 | Feb | 202502 |
| ROK | 2025 | 3 | $288.76 | $246.14 | $262.31 | 0.22% | 21 | Mar | 202503 |
| ROK | 2025 | 4 | $259.55 | $212.49 | $235.37 | 0.69% | 21 | Apr | 202504 |
| ROK | 2025 | 5 | $313.86 | $244.10 | $292.23 | 0.99% | 21 | May | 202505 |
| ROK | 2025 | 6 | $330.19 | $308.85 | $320.77 | 0.98% | 20 | Jun | 202506 |
| ROK | 2025 | 7 | $358.22 | $327.46 | $346.41 | 0.70% | 22 | Jul | 202507 |
| ROK | 2025 | 8 | $356.05 | $303.16 | $341.28 | 0.74% | 21 | Aug | 202508 |
| ROK | 2025 | 9 | $350.22 | $333.08 | $342.48 | 0.88% | 21 | Sep | 202509 |
| ROK | 2025 | 10 | $373.65 | $331.49 | $350.56 | 0.84% | 23 | Oct | 202510 |
| ROK | 2025 | 11 | $398.82 | $352.81 | $377.65 | 0.94% | 19 | Nov | 202511 |
| ROK | 2025 | 12 | $415.89 | $387.00 | $398.88 | 0.07% | 22 | Dec | 202512 |
| ROK | 2026 | 1 | $429.58 | $390.32 | $414.80 | 0.80% | 20 | Jan | 202601 |
| ROK | 2026 | 2 | $438.72 | $375.72 | $405.82 | 0.50% | 19 | Feb | 202602 |
| ROK | 2026 | 3 | $412.73 | $347.58 | $366.60 | 0.17% | 22 | Mar | 202603 |
| ROK | 2026 | 4 | $421.03 | $356.79 | $397.07 | 0.81% | 21 | Apr | 202604 |
| ROK | 2026 | 5 | $463.49 | $400.31 | $444.16 | 0.80% | 20 | May | 202605 |
| ROK | 2026 | 6 | $474.99 | $439.70 | $457.58 | 0.54% | 13 | Jun | 202606 |
| TYL | 2025 | 1 | $626.08 | $558.37 | $583.66 | 0.64% | 20 | Jan | 202501 |
| TYL | 2025 | 2 | $661.31 | $587.49 | $618.89 | 0.28% | 19 | Feb | 202502 |
| TYL | 2025 | 3 | $626.56 | $552.27 | $580.95 | 0.39% | 21 | Mar | 202503 |
| TYL | 2025 | 4 | $586.11 | $513.52 | $554.99 | 0.41% | 21 | Apr | 202504 |
| TYL | 2025 | 5 | $580.64 | $533.14 | $564.95 | 0.92% | 21 | May | 202505 |
| TYL | 2025 | 6 | $594.05 | $557.24 | $579.71 | 0.97% | 20 | Jun | 202506 |
| TYL | 2025 | 7 | $595.21 | $548.37 | $567.23 | 0.77% | 22 | Jul | 202507 |
| TYL | 2025 | 8 | $621.34 | $547.10 | $575.68 | 0.21% | 21 | Aug | 202508 |
| TYL | 2025 | 9 | $566.58 | $516.77 | $540.79 | 0.13% | 21 | Sep | 202509 |
| TYL | 2025 | 10 | $525.06 | $450.00 | $502.08 | 0.35% | 23 | Oct | 202510 |
| TYL | 2025 | 11 | $481.57 | $452.55 | $466.01 | 0.59% | 19 | Nov | 202511 |
| TYL | 2025 | 12 | $472.00 | $445.64 | $458.53 | 0.32% | 22 | Dec | 202512 |
| TYL | 2026 | 1 | $460.68 | $365.70 | $433.55 | 0.04% | 20 | Jan | 202601 |
| TYL | 2026 | 2 | $373.49 | $283.72 | $332.83 | 0.79% | 19 | Feb | 202602 |
| TYL | 2026 | 3 | $377.77 | $327.39 | $350.66 | 0.30% | 22 | Mar | 202603 |
| TYL | 2026 | 4 | $366.63 | $314.07 | $336.25 | 0.52% | 21 | Apr | 202604 |
| TYL | 2026 | 5 | $358.50 | $294.36 | $315.51 | 0.29% | 20 | May | 202605 |
| TYL | 2026 | 6 | $331.54 | $285.86 | $304.08 | 0.04% | 13 | Jun | 202606 |
| VLTO | 2025 | 1 | $104.30 | $99.32 | $101.88 | 0.72% | 20 | Jan | 202501 |
| VLTO | 2025 | 2 | $102.91 | $95.08 | $98.68 | 0.54% | 19 | Feb | 202502 |
| VLTO | 2025 | 3 | $101.97 | $93.92 | $97.60 | 0.40% | 21 | Mar | 202503 |
| VLTO | 2025 | 4 | $98.44 | $83.58 | $90.76 | 0.81% | 21 | Apr | 202504 |
| VLTO | 2025 | 5 | $102.31 | $93.22 | $98.93 | 0.82% | 21 | May | 202505 |
| VLTO | 2025 | 6 | $101.56 | $96.13 | $98.89 | 0.84% | 20 | Jun | 202506 |
| VLTO | 2025 | 7 | $106.75 | $99.34 | $102.64 | 0.71% | 22 | Jul | 202507 |
| VLTO | 2025 | 8 | $109.85 | $103.15 | $107.24 | 0.42% | 21 | Aug | 202508 |
| VLTO | 2025 | 9 | $109.60 | $103.08 | $106.02 | 0.52% | 21 | Sep | 202509 |
| VLTO | 2025 | 10 | $107.76 | $95.72 | $103.15 | 0.24% | 23 | Oct | 202510 |
| VLTO | 2025 | 11 | $104.20 | $96.89 | $98.92 | 0.58% | 19 | Nov | 202511 |
| VLTO | 2025 | 12 | $103.96 | $96.80 | $100.58 | 0.42% | 22 | Dec | 202512 |
| VLTO | 2026 | 1 | $103.42 | $97.08 | $100.94 | 0.30% | 20 | Jan | 202601 |
| VLTO | 2026 | 2 | $101.50 | $88.42 | $94.02 | 0.69% | 19 | Feb | 202602 |
| VLTO | 2026 | 3 | $97.80 | $84.99 | $90.59 | 0.27% | 22 | Mar | 202603 |
| VLTO | 2026 | 4 | $92.75 | $85.46 | $89.39 | 0.38% | 21 | Apr | 202604 |
| VLTO | 2026 | 5 | $89.51 | $80.03 | $86.20 | 0.23% | 20 | May | 202605 |
| VLTO | 2026 | 6 | $87.15 | $82.03 | $83.89 | 0.14% | 13 | Jun | 202606 |
==================================================
🔍 SIGNIFICANT OPPORTUNITIES: 25.1% of stocks are in historically low positions, suggesting potential buying opportunities.
⚠️ CAUTION ADVISED: 74.9% of stocks are at historically high levels, suggesting potential profit-taking areas.
📊 MARKET POSITIONING: Average position of 0.654 indicates stocks are generally trading in the upper half of their monthly ranges.
⚖️ NEUTRAL MOMENTUM: Average momentum of 1.55% shows balanced price action.
TRADING CONSIDERATIONS:
• Consider profit-taking: 131 stocks in high zone vs 44 in low zone
• Position sizing: Monitor 0.254 position volatility
• Data quality: Based on 5.0 years of historical data on average
Generated by Seasonal Dashboard Analyzer
Last updated: 2026-06-17 22:26:07 EST