

: Risk, Return, and Retail Investor Outcomes
The NASDAQ post-IPO performance from 2023 to 2025 reveals a stark reality for retail investors, where extreme volatility, capital erosion, and asymmetric return outcomes dominate early post-listing trading. Analyzing 657 NASDAQ-listed IPO stocks using post-listing adjusted close prices, this study examines how newly public companies actually performed after entering the secondary market—highlighting return distributions, downside risk, and rare multi-bagger winners. The findings show that while a handful of IPO stocks delivered extraordinary gains exceeding 1,000%–2,800%, the majority generated negative returns, with a significant portion losing over 75% of their value, underscoring the speculative nature of IPO investing and the importance of disciplined risk allocation.
Executive Summary
This study analyzes 657 NASDAQ-listed IPO stocks between January 1, 2023 and December 12, 2025, focusing on post-listing performance, not the IPO offer price.
Key Findings:
- 62% of Post IPO stocks generated negative returns
- 31% lost more than 75% of their value
- Only ~4.6% delivered gains above 100%
- A small number of extreme winners (up to +2,833%) offset a large number of near-total losses
- Maximum loss for retail investors is capped at 100%, while upside can exceed 2000%
Conclusion:
IPO investing offers asymmetric returns — limited downside but rare, outsized upside. It is suitable only for investors with idle capital, high risk tolerance, and disciplined portfolio allocation.
Methodology & Important Clarification (Very Important)
⚠️ This analysis does NOT use the IPO offer price.
Performance Calculation Basis:
- Starting price: Adjusted Close price on the first trading day after IPO
- Ending price: Adjusted Close price on December 12, 2025
- Prices are split-adjusted and dividend-adjusted
- Returns reflect secondary market performance after listing, not IPO subscription gains
👉 Therefore, this study measures how IPO stocks performed after becoming publicly tradable, which is what most retail investors actually experience.
What Is Common Stock?
Common stock represents ownership in a company and provides investors with:
- Participation in capital appreciation
- Voting rights in corporate decisions
- Residual claim on assets
- No guaranteed dividends or returns
Common stocks offer long-term wealth potential, but prices are fully exposed to business risk, valuation risk, and market volatility.
Maximum Risk for Retail Investors
For common stock investors:
- ✅ Maximum loss = 100% of invested capital
- ❌ Losses cannot exceed the invested amount
- ⚠️ Stocks can decline close to zero
Your IPO data confirms this reality, with multiple stocks losing ~99.99% of their post-listing value.
NASDAQ IPO Performance Distribution (2023–2025)
(Based on post-listing adjusted close prices)
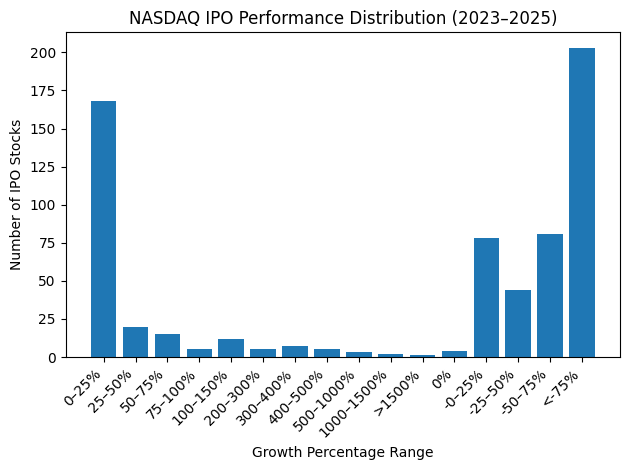
The chart above shows a highly skewed return distribution:
NASDAQ Post IPO Positive Return Breakdown
- 0–25%: 168 stocks
- >100%: 30 stocks
- >500%: 6 stocks
- >1500%: 1 stock
NASDAQ Post IPO Negative Return Breakdown
- Loss >75%: 203 stocks
- Loss 50–75%: 81 stocks
- Loss 25–50%: 44 stocks
📌 Severe losses are far more common than extreme gains.
NASDAQ Post IPO Top 10 IPO Gainers (Post-Listing Performance)
| Rank | Symbol | Return (%) |
|---|---|---|
| 1 | QMMM | +2833.66 |
| 2 | ABVX | +1412.59 |
| 3 | DGNX | +1026.19 |
| 4 | PVLA | +668.36 |
| 5 | NNE | +582.27 |
| 6 | INBX | +536.22 |
| 7 | ANPA | +442.90 |
| 8 | ATGL | +438.64 |
| 9 | GRAL | +434.24 |
| 10 | SEZL | +420.60 |
🔍 These stocks demonstrate that exceptional upside is possible, but such outcomes are statistically rare.
NASDAQ Post IPO Top 10 IPO Losers (Post-Listing Performance)
| Rank | Symbol | Return (%) |
|---|---|---|
| 1 | VCIG | −99.9993 |
| 2 | CDT | −99.9986 |
| 3 | GDHG | −99.9963 |
| 4 | DCX | −99.9958 |
| 5 | CISS | −99.9955 |
| 6 | CAUD | −99.9921 |
| 7 | YHC | −99.9848 |
| 8 | NWTG | −99.9814 |
| 9 | ELAB | −99.9769 |
| 10 | WOK | −99.9700 |
⚠️ These outcomes highlight the capital erosion risk present in post-IPO trading.
Post IPO Investing: Opportunity or Trap?
When IPO Investing May Be Rational
IPO or early post-IPO investing may be appropriate if:
- The investor has idle/surplus capital
- Can tolerate high volatility and drawdowns
- Accepts full capital loss risk
- Allocates only a small portion of portfolio
- Maintains long-term patience
📈 In such cases, investors may achieve returns exceeding 2000%, as seen in rare but real examples.
When Investors Should Avoid Post IPOs
Post IPO investing may be unsuitable when:
- Capital preservation is a priority
- Investment decisions are driven by hype
- Portfolio risk is already elevated
- There is limited understanding of valuation and business fundamentals
NASDAQ Post IPO vs Matured Secondary Market Investing
| Aspect | IPO / Early Post-IPO | Mature Secondary Market |
|---|---|---|
| Valuation clarity | Limited | Higher |
| Volatility | Extreme | Lower |
| Failure risk | High | Moderate |
| Upside potential | Very high (rare) | Moderate |
Waiting for post-IPO price stabilization often reduces downside risk, though it may limit extreme upside.
Final Data-Supported Conclusion
Analysis of 657 NASDAQ IPO stocks (2023–2025) shows:
- Post IPO investing is high-risk and non-linear
- Most IPO stocks destroy capital
- A few extraordinary winners create the illusion of broad success
- Retail investors face a maximum loss of 100%, but potential upside can exceed 2000%
📌 IPO investing should be treated as speculative capital allocation, not core investing.
For disciplined investors with surplus funds, IPO exposure can be rewarding.
For most investors, selective post-IPO investing with strong fundamentals offers a more sustainable risk–return balance.
We welcome thoughtful opinions and experiences related to IPO investing.
If you have insights or personal observations, feel free to share them in the comments below.
Compliance & Disclosure Note
This article is for educational and informational purposes only and does not constitute investment advice. Past performance does not guarantee future results. Data Source: Yahoo Finance and Alpha Vantage.
Written By-Md Kollol Hossain, CEO, CapitalinsightBD
Important Links:
Understanding Business Financial Health-A Practical Guide to Cash Flow Analysis
Bond, Stock/Equity Securities and Preferred Stock
Portfolio, Portfolio Diversification and Management
US vs Bangladesh Stock Markets-A Comprehensive Comparative Analysis for Strategic Investors
The S&P 500 Index: Structure and Investment Strategies
S&P 500 Index Performance and Earnings Anatomy (2020–2025)
S&P 500 Weekly Market Summary
This article is for educational purposes only and does not constitute financial or investment advice.