📊 Introduction
Welcome to the S&P 500 vs NASDAQ 100 Market Comparison Intelligence Dashboard, a comprehensive, data-driven analytics platform built to deliver real-time U.S. stock market intelligence through advanced quantitative analysis, sector analytics, and institutional-grade visualizations.
This dashboard provides a side-by-side comparison of the S&P 500 Index and the NASDAQ 100 Index, enabling investors, traders, analysts, and researchers to evaluate index performance trends, sector weightage, market breadth, volatility, rolling correlation, and leadership dynamics in a single unified view.
The S&P 500 Index, representing the broader U.S. large-cap equity market, includes diversified exposure across Technology, Financials, Healthcare, Energy, Industrials, Consumer Discretionary, and Consumer Staples, with influential companies such as Apple (AAPL), Microsoft (MSFT), NVIDIA (NVDA), Amazon (AMZN), JPMorgan Chase (JPM), Exxon Mobil (XOM), Johnson & Johnson (JNJ), Procter & Gamble (PG), and Berkshire Hathaway (BRK.B) shaping overall market direction.
In contrast, the NASDAQ 100 Index is heavily tilted toward technology, innovation, and growth-oriented companies, featuring global leaders like Apple (AAPL), Microsoft (MSFT), NVIDIA (NVDA), Alphabet / Google (GOOGL), Meta Platforms (META), Tesla (TSLA), Amazon (AMZN), Broadcom (AVGO), Adobe (ADBE), and ASML Holding (ASML). This makes the NASDAQ 100 a critical benchmark for tracking AI, semiconductor, cloud computing, digital advertising, electric vehicles, and next-generation technology trends.
Whether you are:
- Monitoring large-cap U.S. stocks
- Comparing technology-heavy growth indices vs diversified market exposure
- Tracking sector rotation between Financials, Technology, Energy, and Healthcare
- Analyzing risk, volatility, and correlation for portfolio allocation
- Or assessing broader U.S. equity market sentiment
this dashboard delivers actionable market intelligence supported by automated data processing, statistical modeling, and performance-optimized visualization, designed for both retail investors and professional market participants.
🔑 Key Market Coverage
S&P 500 Index (SPX):
- Represents 500 leading U.S. large-cap companies
- Key sectors: Financials, Healthcare, Energy, Industrials, Consumer Staples
- Major stocks: Apple (AAPL), Microsoft (MSFT), NVIDIA (NVDA), Amazon (AMZN), Exxon Mobil (XOM), JPMorgan Chase (JPM)
NASDAQ 100 Index (NDX):
- Focuses on 100 largest non-financial NASDAQ-listed companies
- Technology-heavy with strong growth orientation
- Major stocks: Apple (AAPL), Microsoft (MSFT), NVIDIA (NVDA), Alphabet (GOOGL), Tesla (TSLA), Meta Platforms (META)
Our analytics engine processes millions of data points daily to provide:
- Real-time index performance with rolling trend analysis
- Interactive charts for relative strength comparison
- Sector weight and composition analysis
- Market movers, momentum signals, and volatility insights
- Historical tracking including 52-week highs and lows
All data is automatically updated, optimized for speed, and structured for both retail investors and professional analysts.
📈 Dashboard Components Explained
1. Summary Metrics Table
Purpose: Instant snapshot of overall market health
Includes:
- Current index levels (SP500 & NASDAQ100)
- Daily percentage & point changes
- Year-to-Date (YTD) performance
- 52-Week High / Low range
- Total market capitalization
Why it matters:
This table helps you instantly assess market direction, strength, and relative outperformance between the broader market and growth-focused technology stocks.
2. Performance Comparison Chart
Visual Analysis: 90-Day Normalized Performance
- Blue Line: NASDAQ 100
- Green Line: S&P 500
- Normalized Base: Both indices start at 100 for fair comparison
- Insight: Identifies leadership between tech-heavy growth stocks and diversified large-cap stocks
Investment Insight:
Ideal for spotting trend dominance, momentum shifts, and relative strength between technology and the broader U.S. equity market.
3. Rolling Correlation Chart
Statistical Analysis: 20-Day Rolling Correlation of Daily Returns
- +1.0: Perfect positive correlation
- 0.0: No relationship
- -1.0: Perfect negative correlation
Practical Use:
- Portfolio diversification assessment
- Risk management and hedging strategies
- Detecting market regime changes
4. Daily Returns Distribution Chart
Risk & Volatility Analysis
- Distribution of daily index returns
- Mean (average) return
- Standard deviation (volatility)
- Skewness (direction of extreme moves)
Why it matters:
Helps investors understand probability of large price movements, essential for options traders, risk managers, and tactical investors.
5. Sector Weight Comparison Chart
Index Composition Analysis
Key Observations:
- NASDAQ 100: Heavy concentration in Technology, Communication Services, Consumer Discretionary
- S&P 500: Broader exposure including Financials, Healthcare, Energy, Industrials
Strategic Value:
- Identifies sector concentration risk
- Helps track sector rotation
- Supports asset allocation and thematic investing
6. Market Movers Tables
Stock-Level Intelligence
S&P 500 Movers
- Top Gainers
- Top Losers
- 52-Week High Stocks
- 52-Week Low Stocks
NASDAQ 100 Movers
- Technology leaders
- High-momentum growth stocks
- Volatility-driven opportunities
- Top Gainers
- Top Losers
- 52-Week High Stocks
- 52-Week Low Stocks
Why it matters:
Highlights market sentiment, momentum shifts, and potential trading opportunities across both indices.
7. Performance Metrics Cards
Quantitative Snapshot
- 30-Day Returns
- Annualized Volatility (30-day window)
- Index Correlation Strength
- Latest Daily Performance
- Risk-adjusted performance metrics
Use Case:
Ideal for comparing return vs risk, especially when allocating between growth and defensive strategies.
🔍 How to Use This Dashboard Effectively
For Long-Term Investors
- Track correlation trends for diversification
- Monitor sector exposure and rebalance portfolios
- Use 52-week ranges for valuation context
- Analyze volatility before adding positions
For Active Traders
- Identify momentum stocks via market movers
- Monitor volatility distributions
- Use correlation for pairs trading
- Track sector leadership changes
For Financial Analysts
- Perform correlation and volatility modeling
- Analyze market structure changes
- Compare benchmark performance
- Support macro and thematic research
❓ Frequently Asked Questions (FAQs)
Q1: How often is the data updated?
A: The dashboard updates automatically at the closing of the trading day. Summary metrics and comprehensive updates occur at market close with full overnight processing.
Q2: What time period does the performance chart cover?
A: The performance comparison chart displays the last 90 trading days, providing a balanced view of short-to-medium-term trends while filtering out market noise.
Q3: How is the correlation coefficient calculated?
A: We use a 20-day rolling correlation calculation based on daily returns. This measures how closely the S&P 500 and NASDAQ 100 move together over the recent period.
Q4: Why are there differences between S&P 500 and NASDAQ 100 sector weights?
A: The S&P 500 represents 500 large-cap U.S. companies across all sectors, while NASDAQ 100 focuses on the 100 largest non-financial companies listed on NASDAQ, with heavy technology weighting.
Q5: What does “annualized volatility” mean?
A: This projects the observed 30-day volatility over a full year, giving you a standardized measure of risk that’s comparable across different time periods.
Q6: How are the top gainers/losers selected?
A: We analyze all constituent stocks of each index and rank them by daily percentage change, displaying the top 10 performers in each category.
Q7: Can I use this data for trading decisions?
A: This dashboard provides analytical tools and market intelligence, but all trading decisions should be made in consultation with financial advisors and based on your individual risk tolerance.
Q8: Why do some tables show “data not available”?
A: Occasionally, data processing or market closures may delay updates. The system automatically refreshes, and data typically appears within minutes of availability.
Q9: How is the 52-week range calculated?
A: We track the highest and lowest closing prices for each index over the past 252 trading days (approximately one calendar year).
Q10: What’s the difference between daily change and YTD performance?
A: Daily change shows today’s movement only, while YTD (Year-to-Date) performance shows cumulative returns from January 1st to the current date.
Important Links:
NASDAQ 100 Weekly Market Pulse
SP 500 News Sentiment Analysis Tool
S&P 500 Stocks Close to 52-W High
SP 500 Main Financial Performance Dashboard
📊 Data Sources and Methodology
Primary Sources
- Major U.S. stock exchanges
- Institutional financial data providers
- Sector and index classification databases
Methodology Highlights
- Normalized index performance (base = 100)
- Rolling statistical calculations
- Dividend-adjusted total return analysis
- Historical daily return distributions
🔒 Data Accuracy & Disclaimer
This dashboard is intended for educational and informational purposes only.
It does not constitute investment advice. Market data may be delayed or revised due to corporate actions or market volatility.
🎯 Who Benefits from This Dashboard?
- Retail Investors: Market tracking & allocation decisions
- Financial Professionals: Client reporting & strategy building
- Researchers: Market correlation & volatility studies
- Business Analysts: Sector and macro trend monitoring
💡 Pro Tips for Maximum Value
- Watch correlation breakdowns — often signal regime shifts
- Compare sector weight divergence for rotation strategies
- Combine volatility + performance for risk-adjusted insights
- Use 52-week extremes as sentiment indicators
🔄 Keeping Your Analysis Current
Daily: Performance, movers, correlation
Weekly: Trend strength, volatility shifts
Monthly: Strategic allocation review
Update Frequency:
- End-of-day: Comprehensive data processing, historical analysis and chart generation
🔒 Data Accuracy and Disclaimer
Accuracy Commitment:
We employ multiple verification systems to ensure data accuracy, including:
- Cross-referencing with multiple data providers
- Automated error detection algorithms
- Manual quality checks for critical metrics
Limitations:
- Data may be delayed during high market volatility
- Corporate actions may cause temporary data discrepancies
- System maintenance occurs during non-market hours
- International market events may affect U.S. indices
This comprehensive dashboard represents the culmination of advanced financial analytics and data visualization techniques. By understanding each component and how they interrelate, you gain powerful insights into market dynamics that can inform better investment decisions.
Analysts: Md Kollol Hossain, CEO, CapitalinsightBD
S&P 500 vs NASDAQ 100 Market Analysis
Comparison with optimized performance • Updated: June 25, 2026 2:53 AM
Summary Metrics
| Metric | NASDAQ 100 | S&P 500 | Difference |
|---|---|---|---|
| Current Price | $29,220.06 | $7,358.22 | $21,861.84 |
| Daily Change | -0.43% | -0.10% | -0.34% |
| 30D Return | -0.5% | -1.2% | +0.7% |
| 30D Volatility | 27.9% | 15.5% | 12.4% |
| Correlation | - | - | 0.915 |
| YTD Return | +26.3% | +15.5% | +10.8% |
Market Analysis Charts
Performance Comparison
90 Days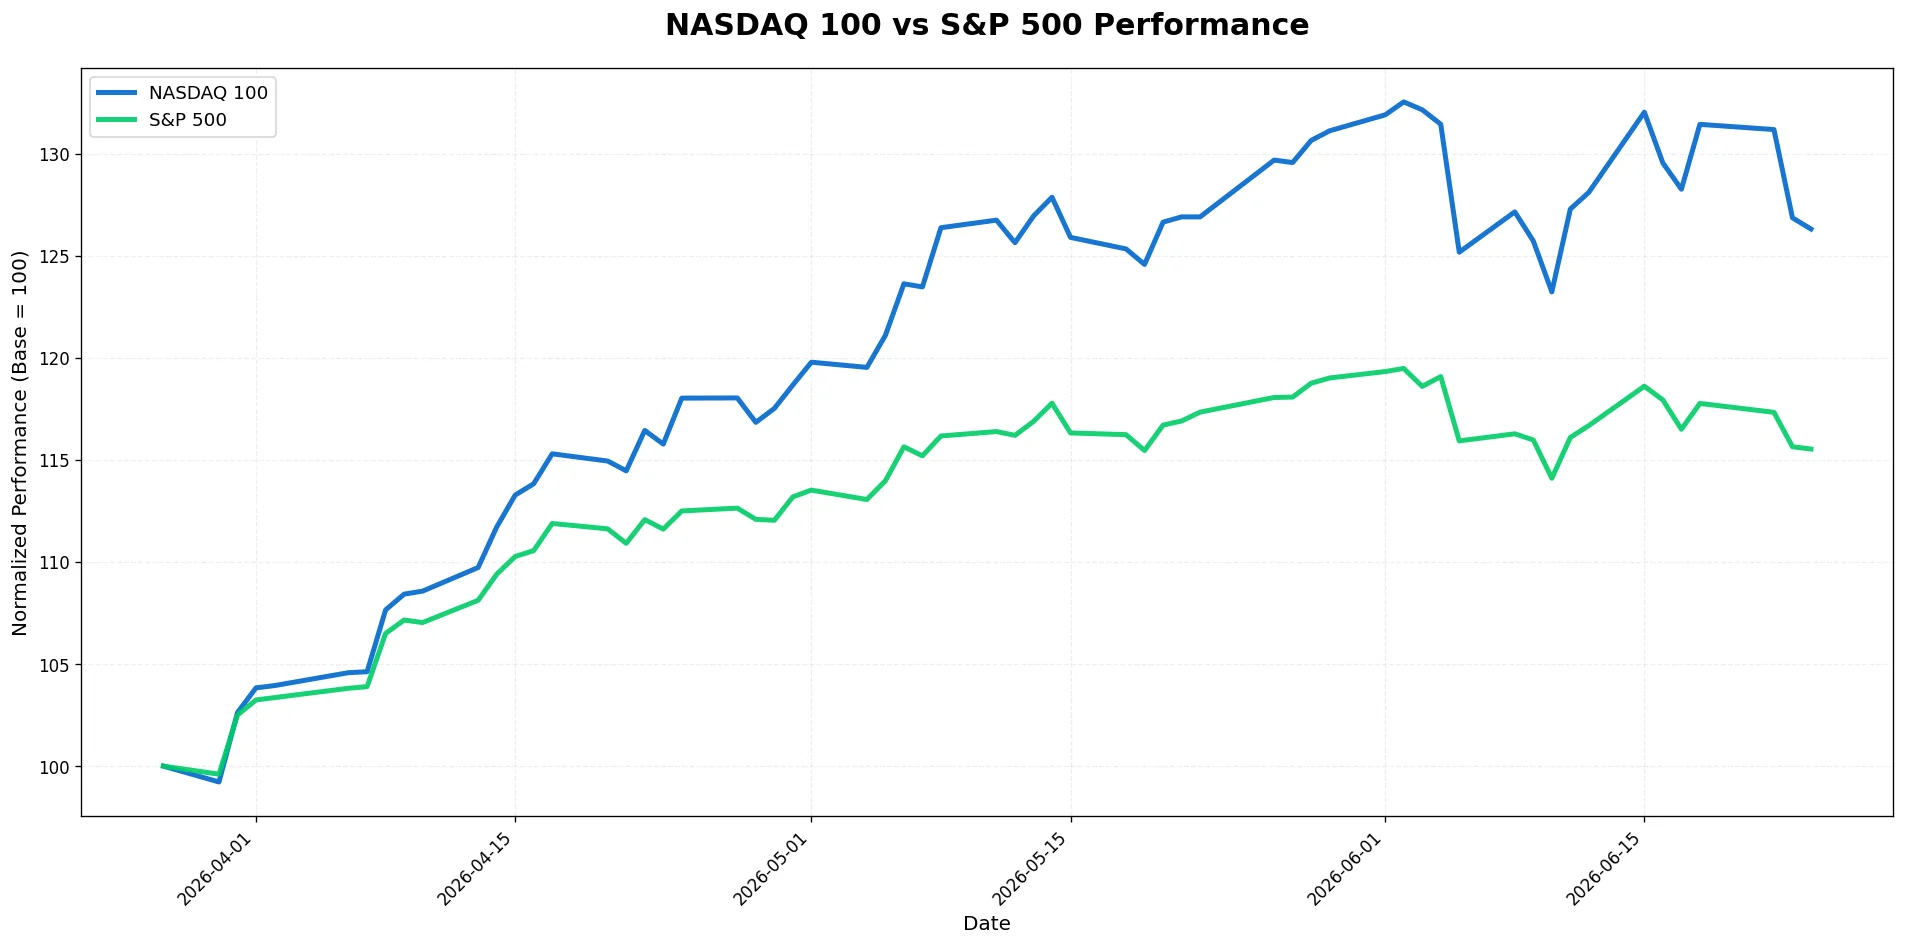
Rolling Correlation
20-Day Window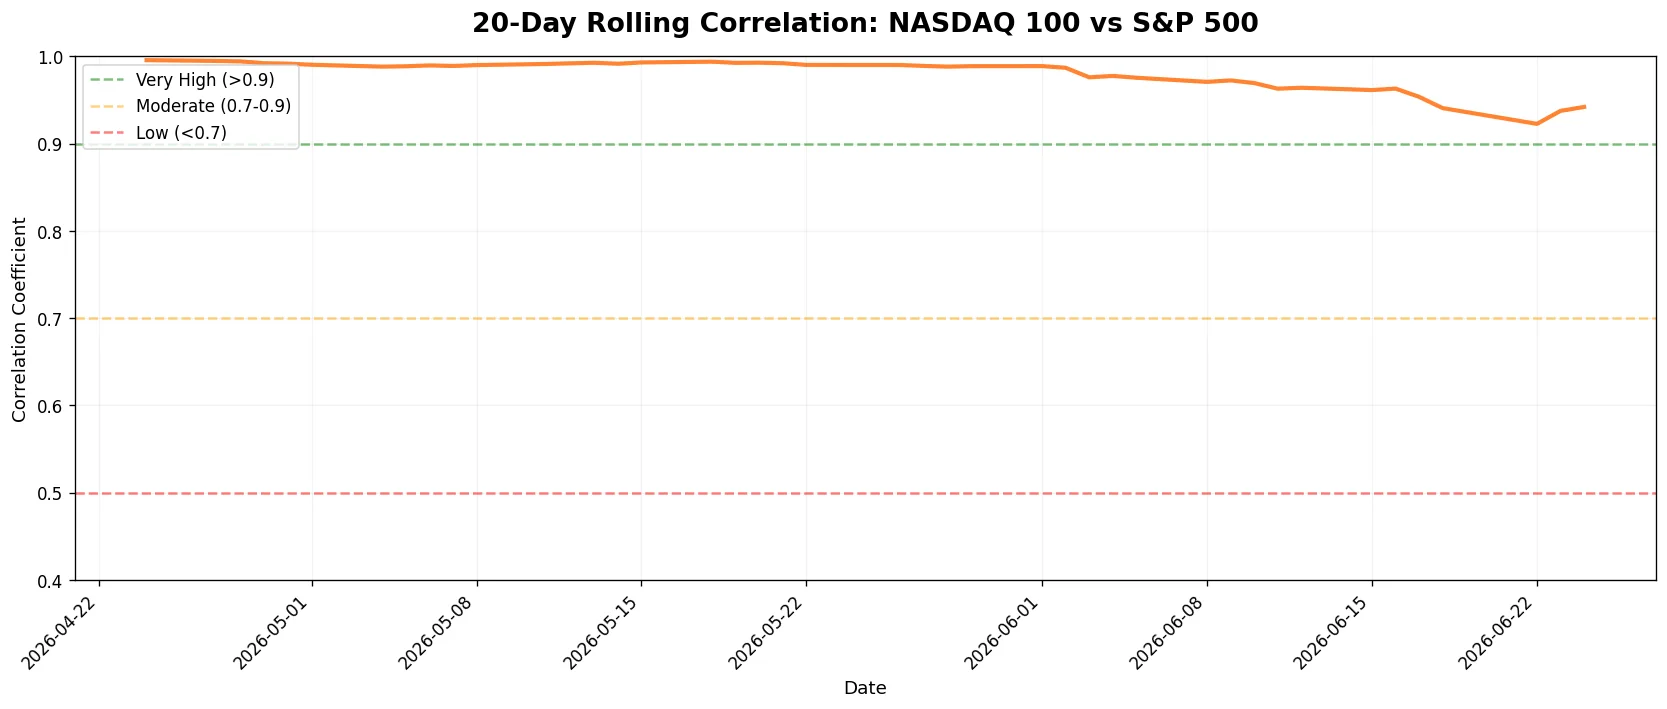
Daily Returns Distribution
Statistical Analysis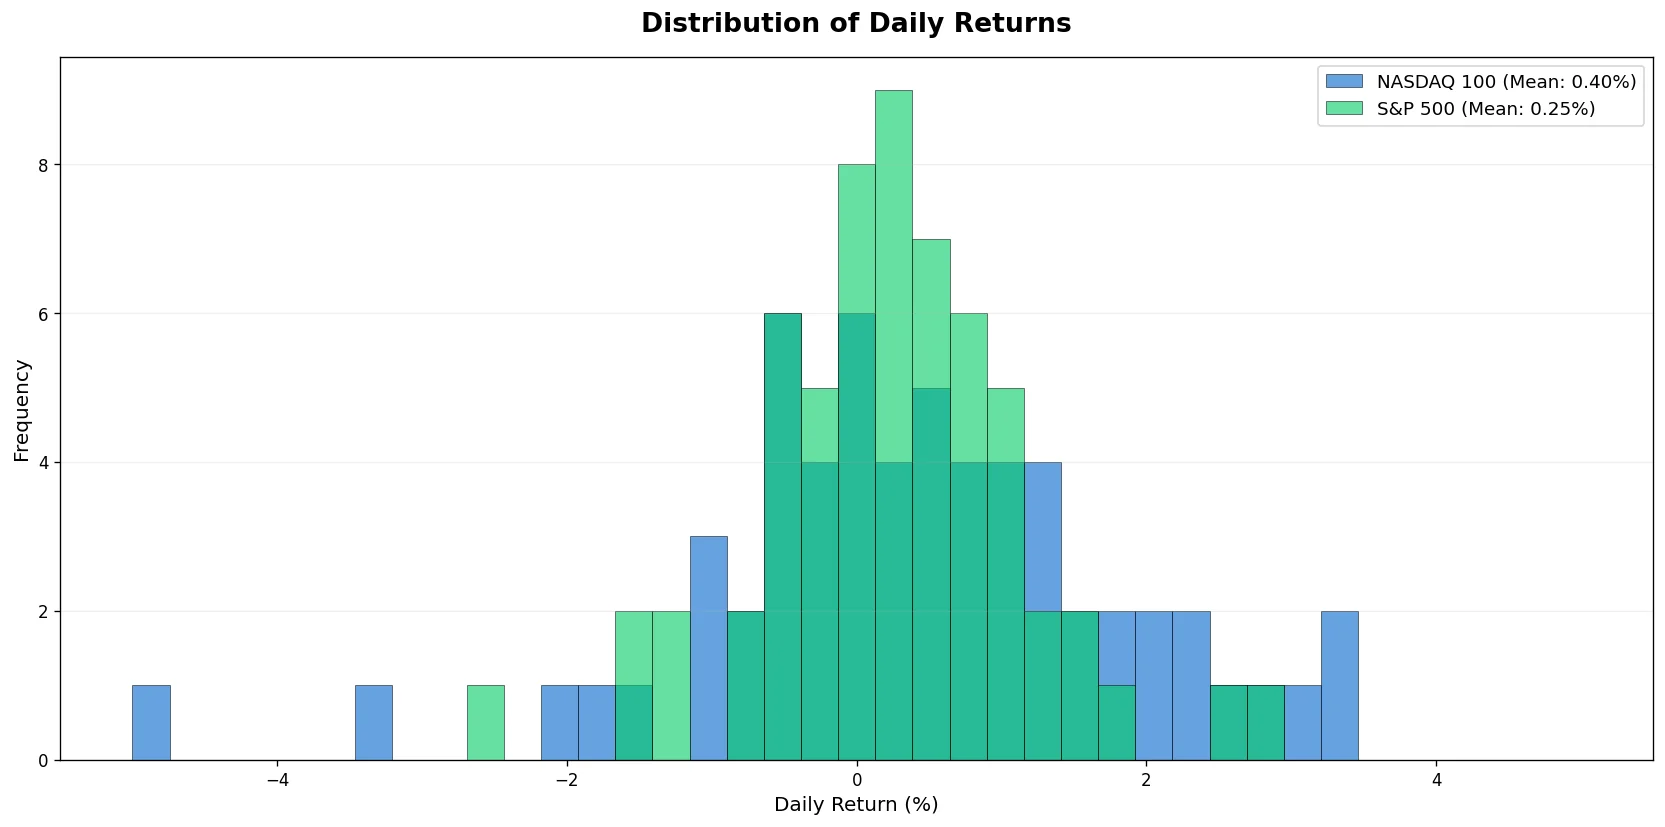
Sector Weight Comparison
Top 8 Sectors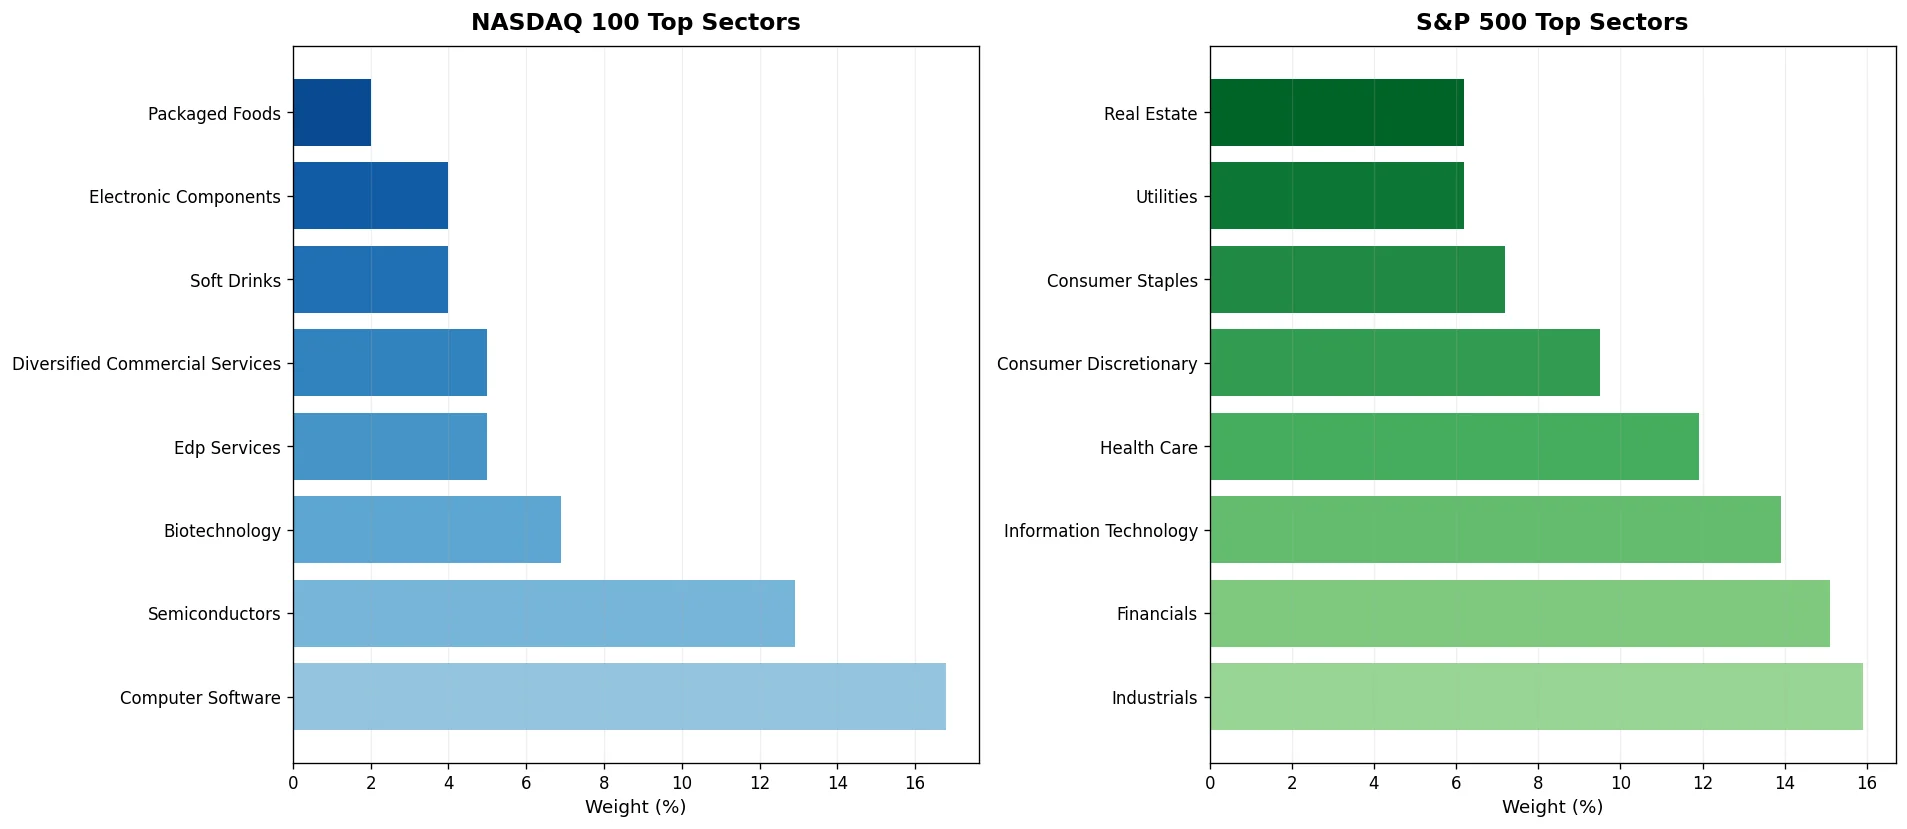
Market Movers
S&P 500 Daily Top Ten Gainers
+| Rank | Ticker | Company | Sector | Change | Price |
|---|---|---|---|---|---|
| 1 | BLDR | Builders FirstSource | Industrials | +7.90% | $85.41 |
| 2 | GDDY | GoDaddy | Information Technology | +7.51% | $81.33 |
| 3 | IQV | IQVIA | Health Care | +6.26% | $185.62 |
| 4 | BKNG | Booking Holdings | Consumer Discretionary | +5.89% | $181.25 |
| 5 | GLW | Corning Inc. | Information Technology | +5.87% | $205.83 |
| 6 | AXON | Axon Enterprise | Industrials | +5.57% | $456.73 |
| 7 | SWK | Stanley Black & Decker | Industrials | +5.33% | $89.66 |
| 8 | MAS | Masco | Industrials | +5.30% | $78.05 |
| 9 | UAL | United Airlines Holdings | Industrials | +5.27% | $130.54 |
| 10 | UBER | Uber | Industrials | +5.05% | $73.85 |
S&P 500 Daily Top Ten Losers
-| Rank | Ticker | Company | Sector | Change | Price |
|---|---|---|---|---|---|
| 1 | APO | Apollo Global Management | Financials | -5.69% | $122.60 |
| 2 | ARES | Ares Management | Financials | -5.20% | $113.87 |
| 3 | COIN | Coinbase | Financials | -5.16% | $150.11 |
| 4 | HOOD | Robinhood Markets | Financials | -5.04% | $97.19 |
| 5 | CME | CME Group | Financials | -4.95% | $231.68 |
| 6 | DD | DuPont | Materials | -4.79% | $137.82 |
| 7 | BX | Blackstone Inc. | Financials | -4.71% | $112.99 |
| 8 | TTWO | Take-Two Interactive | Communication Services | -4.55% | $235.77 |
| 9 | MET | MetLife | Financials | -3.90% | $84.60 |
| 10 | BEN | Franklin Resources | Financials | -3.88% | $32.47 |
S&P 500 Top Ten 52 Week High
52W H| Rank | Ticker | Company | Sector | Fifty Two Weeks Range | Price |
|---|---|---|---|---|---|
| 1 | GWW | W. W. Grainger | Industrials | 1365.41-906.52 | $1365.41 |
| 2 | TGT | Target Corporation | Consumer Staples | 141.25-83.44 | $141.20 |
| 3 | UAL | United Airlines Holdings | Industrials | 130.6-76.17 | $130.54 |
| 4 | DAL | Delta Air Lines | Industrials | 90.71-47.81 | $90.65 |
| 5 | PFG | Principal Financial Group | Financials | 112.45-74.27 | $112.36 |
| 6 | SNDK | Sandisk | Information Technology | 2191.69-40.1 | $2184.75 |
| 7 | WST | West Pharmaceutical Services | Health Care | 336.82-206.63 | $336.39 |
| 8 | CFG | Citizens Financial Group | Financials | 69.08-41.02 | $68.99 |
| 9 | SPG | Simon Property Group | Real Estate | 222.4-155.2 | $222.15 |
| 10 | CINF | Cincinnati Financial | Financials | 175.98-142.57 | $175.81 |
S&P 500 Top Ten 52 Week Low
52W L| Rank | Ticker | Company | Sector | Fifty Two Weeks Range | Price |
|---|---|---|---|---|---|
| 1 | TTD | Trade Desk (The) | Communication Services | 91.45-18.15 | $18.16 |
| 2 | NFLX | Netflix | Communication Services | 1341.15-71.62 | $71.84 |
| 3 | KLAC | KLA Corporation | Information Technology | 2431.29-236.0 | $237.33 |
| 4 | CHTR | Charter Communications | Communication Services | 422.29-126.0 | $126.23 |
| 5 | NFLX | Netflix | Communication Services | 1341.15-71.81 | $72.82 |
| 6 | BR | Broadridge Financial Solutions | Industrials | 270.85-139.5 | $139.63 |
| 7 | CPRT | Copart | Industrials | 50.11-29.5 | $29.52 |
| 8 | ACN | Accenture | Information Technology | 314.38-155.83 | $156.01 |
| 9 | IT | Gartner | Information Technology | 409.95-133.27 | $133.58 |
| 10 | KLAC | KLA Corporation | Information Technology | 2431.29-236.0 | $238.73 |
NASDAQ 100 Daily Top Ten Gainers
+| Rank | Ticker | Company | Sector | Change | Price |
|---|---|---|---|---|---|
| 1 | SHOP | Shopify | Computer Software | +6.83% | $114.17 |
| 2 | BKNG | Booking Holdings | Transportation Services | +5.89% | $181.25 |
| 3 | AXON | Axon Enterprise | Ordnance & Accessories | +5.57% | $456.73 |
| 4 | ABNB | Airbnb | Diversified Commercial Services | +3.84% | $144.40 |
| 5 | DASH | DoorDash | EDP Services | +3.09% | $177.93 |
| 6 | WDAY | Workday, Inc. | EDP Services | +2.70% | $118.09 |
| 7 | VRSK | Verisk Analytics | Diversified Commercial Services | +2.42% | $180.06 |
| 8 | SBUX | Starbucks | Restaurants | +2.26% | $103.53 |
| 9 | LRCX | Lam Research | Industrial Machinery | +2.16% | $374.80 |
| 10 | LITE | Lumentum | Communication Equipment | +2.16% | $842.53 |
NASDAQ 100 Daily Top Ten Losers
-| Rank | Ticker | Company | Sector | Change | Price |
|---|---|---|---|---|---|
| 1 | MSTR | MicroStrategy | Computer Software | -8.05% | $94.13 |
| 2 | TTWO | Take-Two Interactive | Miscellaneous Amusement & Recreation Services | -4.55% | $235.77 |
| 3 | ARM | Arm Holdings | Semiconductors | -3.90% | $359.08 |
| 4 | SNDK | Sandisk | Electronic Components | -3.47% | $1914.46 |
| 5 | STX | Seagate Technology | Electronic Components | -3.33% | $993.25 |
| 6 | MU | Micron Technology | Semiconductors | -3.17% | $1048.51 |
| 7 | QCOM | Qualcomm | Broadcasting & Communications Equipment | -2.55% | $197.41 |
| 8 | PAYX | Paychex | Diversified Commercial Services | -2.50% | $96.30 |
| 9 | WDC | Western Digital | Electronic Components | -2.22% | $643.83 |
| 10 | TMUS | T-Mobile US | Telecommunications Service Providers | -1.99% | $180.79 |
NASDAQ 100 Top Ten 52 Week High
52W H| Rank | Ticker | Company | Sector | Fifty Two Weeks Range | Price |
|---|---|---|---|---|---|
| 1 | MCHP | Microchip Technology | Semiconductors | 76.20-33.33 | $79.01 |
| 2 | BKR | Baker Hughes | Oil Equipment & Services | 56.73-33.06 | $57.99 |
| 3 | ASML | ASML Holding | Industrial Machinery | 1454.59-574.25 | $1493.47 |
| 4 | LRCX | Lam Research | Industrial Machinery | 229.57-55.98 | $235.56 |
| 5 | BKR | Baker Hughes | Oil Equipment & Services | 54.46-33.06 | $55.09 |
| 6 | MU | Micron Technology | Semiconductors | 435.79-61.42 | $446.06 |
| 7 | AMAT | Applied Materials | Semiconductors | 336.75-122.80 | $341.93 |
| 8 | BKR | Baker Hughes | Oil Equipment & Services | 56.63-33.06 | $57.19 |
| 9 | WDC | Western Digital | Electronic Components | 279.70-28.72 | $285.00 |
| 10 | WDC | Western Digital | Electronic Components | 243.29-28.72 | $246.71 |
NASDAQ 100 Top Ten 52 Week Low
52W L| Rank | Ticker | Company | Sector | Fifty Two Weeks Range | Price |
|---|---|---|---|---|---|
| 1 | BKNG | Booking Holdings | Transportation Services | 5818.24-153.97 | $154.48 |
| 2 | BKNG | Booking Holdings | Transportation Services | 5818.24-153.05 | $154.13 |
| 3 | BKNG | Booking Holdings | Transportation Services | 5818.24-164.05 | $165.93 |
| 4 | BKNG | Booking Holdings | Transportation Services | 5818.24-156.07 | $157.80 |
| 5 | BKNG | Booking Holdings | Transportation Services | 5818.24-153.05 | $154.54 |
| 6 | PYPL | PayPal | Diversified Commercial Services | 90.72-55.01 | $55.03 |
| 7 | BKNG | Booking Holdings | Transportation Services | 5818.24-153.05 | $155.07 |
| 8 | ZS | Zscaler | EDP Services | 336.99-139.32 | $139.41 |
| 9 | ZS | Zscaler | EDP Services | 336.99-159.66 | $159.75 |
| 10 | CHTR | Charter Communications | Cable & Other Pay Television Services | 437.06-154.70 | $154.86 |
Detailed Performance Metrics
30-Day Performance
Volatility (30D Annualized)
Index Correlation
Daily Performance
S&P 500 and NASDAQ Stock Performance Analysis
Our comprehensive analysis platform enables investors to evaluate historical stock performance through both graphical visualization and detailed tabular data. To begin your analysis, please select your preferred market index, choose a specific ticker symbol, define your date range, and click either the “Go” or “Graph” button. The system will instantly generate detailed performance insights including weekly, monthly, quarterly, and annual metrics to support your investment research.
Please select an index type and ticker to display the trading data.
Important Disclaimer:
This dashboard is for informational and educational purposes only. The data presented should not be construed as investment advice. Past performance does not guarantee future results. Always conduct your own research and consult with qualified financial professionals before making investment decisions.