

The NASDAQ 100 Weekly Market Pulse delivers a comprehensive overview of index performance, sector rotation, and stock-level movers within the technology-heavy NASDAQ 100 universe. This analysis tracks weekly index movement, sector gainers and losers, top advancing and declining stocks, and institutional trading trends, helping investors understand market momentum and risk appetite. By covering key technology segments such as semiconductors, software, industrial machinery, electronic components, and consumer technology, alongside influential stocks like Intel (INTC), AMD, Lam Research (LRCX), Micron (MU), and NVIDIA-linked peers, this page serves as a reliable reference for identifying short-term trends, sector leadership, and long-term growth opportunities in U.S. equity markets. The dashboard supports informed decision-making for traders, long-term investors, and analysts monitoring innovation-driven market cycles.
Watch This Week’s NASDAQ 100 Market Breakdown
Prefer watching instead of reading? In just a few minutes, this video explains the biggest market movers, sector rotation, and key events that shaped the NASDAQ 100 during this week. Click Play below for a quick, easy-to-follow weekly market recap.
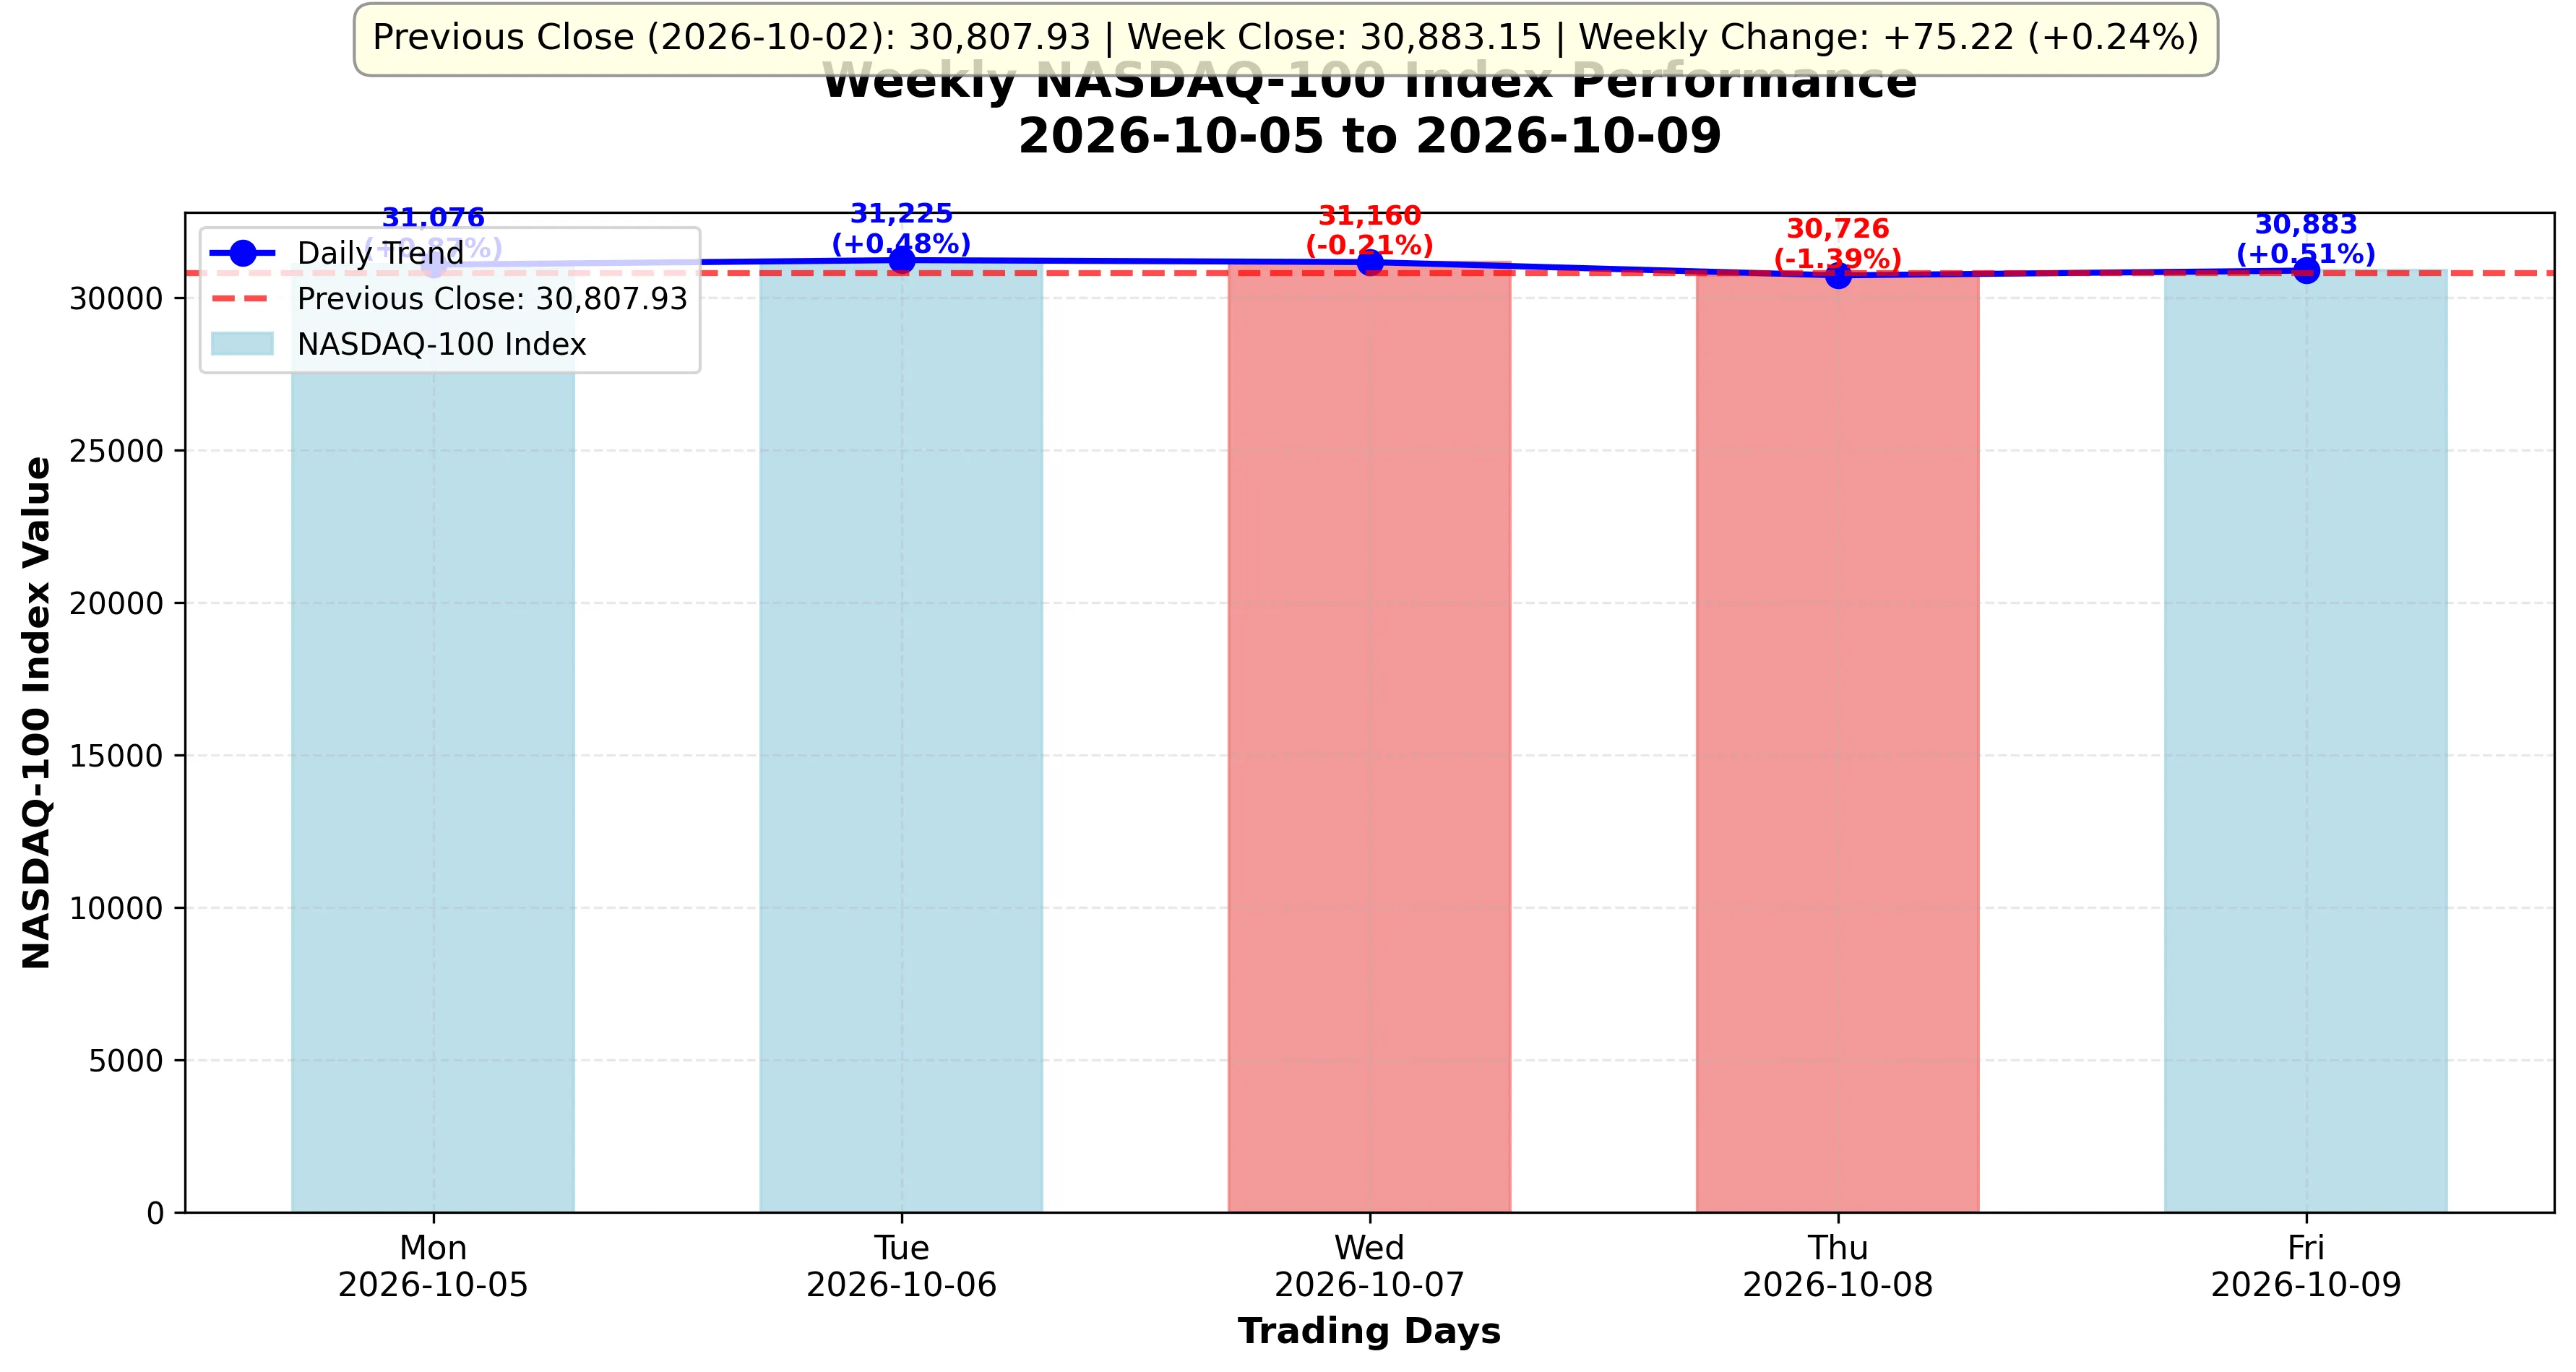
NASDAQ 100 Weekly Market Overview (2026-10-05 - 2026-10-09)
The NASDAQ 100 index edged higher by 75.22 points (+0.24%) this week, opening at 30,807.93 and closing at 30,883.15, reflecting positive sentiment in technology and growth stocks. Market sentiment was mixed with selective buying in quality tech names. Leading technology gainers included ZS (+15.82%), CEG (+11.38%), PLTR (+10.37%), showcasing innovation-driven momentum. On the downside, ARM (-12.09%), STX (-11.73%), WDC (-10.04%) faced profit-taking after recent rallies. Sector leadership came from Electric Utilities and Real Estate, highlighting areas of technological advancement. Market participation was balanced between growth and value segments. Trading volumes suggested institutional repositioning ahead of key earnings reports.
Market Context: This weekly analysis provides insights into NASDAQ 100 performance, technology sector rotation, and growth stock leaders to inform your investment decisions in the tech-heavy index.
📈 NASDAQ 100 Weekly Index Movement
| Date | NASDAQ 100 Close | Point Change | Daily Return % | Point Change From Start | Cumulative Return % |
|---|---|---|---|---|---|
| 2026-10-02 | 30,807.93 | 0.00 | 0.00% | 0.00 | 0.00% |
| 2026-10-05 | 31,076.44 | +268.51 | +0.87% | +268.51 | +0.87% |
| 2026-10-06 | 31,224.69 | +148.24 | +0.48% | +416.75 | +1.35% |
| 2026-10-07 | 31,160.08 | -64.61 | -0.21% | +352.14 | +1.14% |
| 2026-10-08 | 30,725.81 | -434.27 | -1.39% | -82.12 | -0.27% |
| 2026-10-09 | 30,883.15 | +157.34 | +0.51% | +75.22 | +0.24% |
📊 NASDAQ 100 Index Weekly Performance Chart
Visual analysis of NASDAQ 100 index fluctuations throughout the trading week
📈 Data Source: NASDAQ 100 Market Data • 📅 Generated: October 16, 2026 • 🔄 Updated: 08:56 UTC
🏆 NASDAQ 100 Weekly Sector Gainers
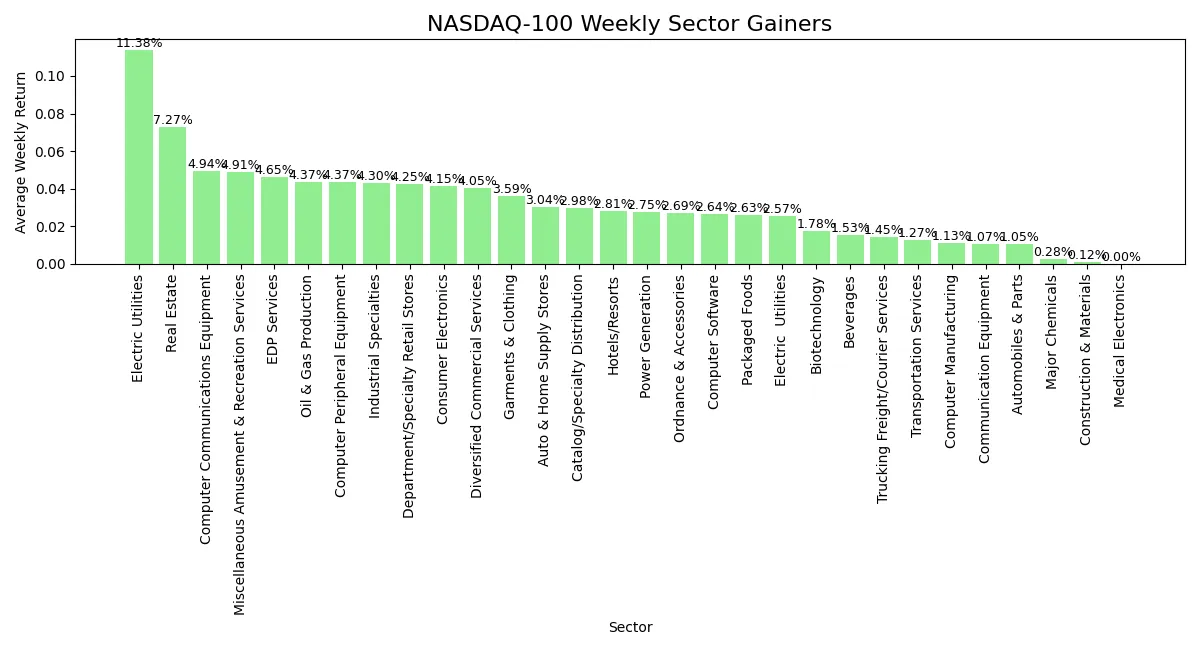
The Electric Utilities sector led the gainers this week with a +11.3800% gain. Complete sector performance is detailed in the table below.
| Sector | Weekly Return (%) |
|---|---|
| Electric Utilities | +11.38% |
| Real Estate | +7.27% |
| Computer Communications Equipment | +4.94% |
| Miscellaneous Amusement & Recreation Services | +4.91% |
| EDP Services | +4.65% |
| Oil & Gas Production | +4.37% |
| Computer Peripheral Equipment | +4.36% |
| Industrial Specialties | +4.30% |
| Department/Specialty Retail Stores | +4.26% |
| Consumer Electronics | +4.15% |
| Diversified Commercial Services | +4.05% |
| Garments & Clothing | +3.59% |
| Auto & Home Supply Stores | +3.04% |
| Catalog/Specialty Distribution | +2.98% |
| Hotels/Resorts | +2.81% |
| Power Generation | +2.75% |
| Ordnance & Accessories | +2.69% |
| Computer Software | +2.64% |
| Packaged Foods | +2.63% |
| Electric Utilities | +2.57% |
| Biotechnology | +1.78% |
| Beverages | +1.53% |
| Trucking Freight/Courier Services | +1.45% |
| Transportation Services | +1.27% |
| Computer Manufacturing | +1.13% |
| Communication Equipment | +1.07% |
| Automobiles & Parts | +1.05% |
| Major Chemicals | +0.28% |
| Construction & Materials | +0.12% |
| Medical Electronics | 0.00% |
🏆 NASDAQ 100 Weekly Sector Gainers Chart
Sector-wise performance analysis showing weekly market leaders
📈 Data Source: NASDAQ 100 Market Data • 📅 Generated: October 16, 2026 • 🔄 Updated: 08:56 UTC
🏭 NASDAQ 100 Weekly Sector Losers
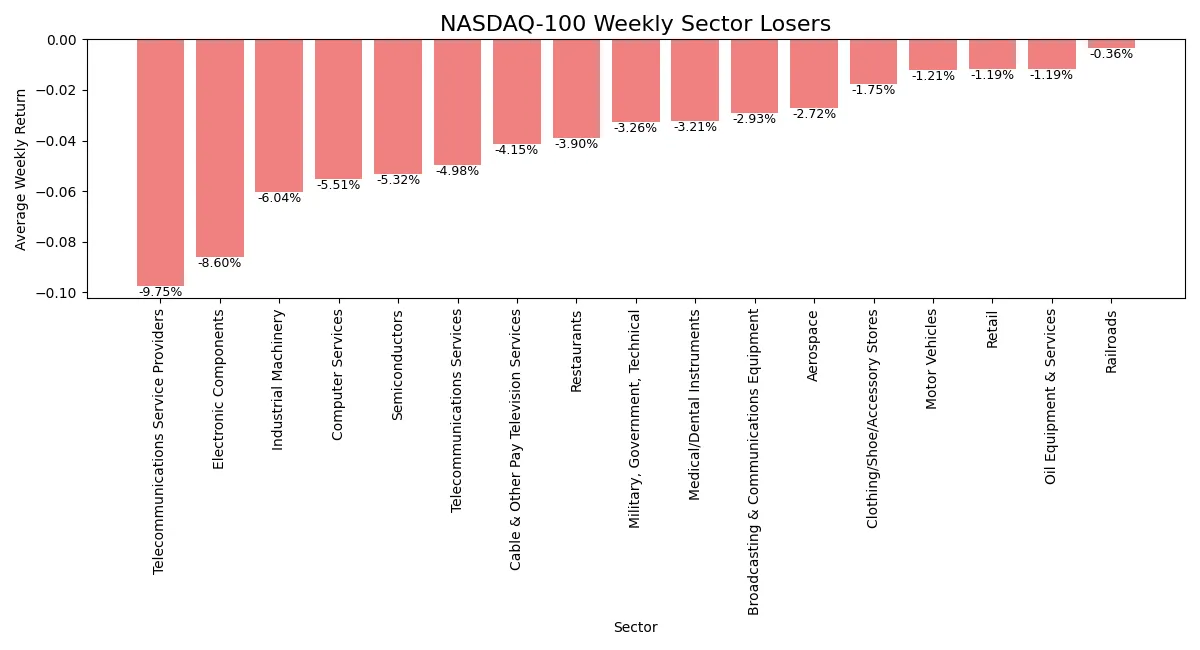
The Telecommunications Service Providers sector led the decliners this week with a -9.7500% loss. Complete sector performance is detailed in the table below.
| Sector | Weekly Return (%) |
|---|---|
| Telecommunications Service Providers | -9.75% |
| Electronic Components | -8.60% |
| Industrial Machinery | -6.04% |
| Computer Services | -5.51% |
| Semiconductors | -5.32% |
| Telecommunications Services | -4.98% |
| Cable & Other Pay Television Services | -4.15% |
| Restaurants | -3.90% |
| Military, Government, Technical | -3.26% |
| Medical/Dental Instruments | -3.21% |
| Broadcasting & Communications Equipment | -2.93% |
| Aerospace | -2.72% |
| Clothing/Shoe/Accessory Stores | -1.75% |
| Motor Vehicles | -1.21% |
| Retail | -1.19% |
| Oil Equipment & Services | -1.19% |
| Railroads | -0.36% |
🏭 NASDAQ 100 Weekly Sector Losers Chart
Sector analysis highlighting areas of weekly weakness in the market
📈 Data Source: NASDAQ 100 Market Data • 📅 Generated: October 16, 2026 • 🔄 Updated: 08:56 UTC
📈 NASDAQ 100 Weekly Top 10 Gainers
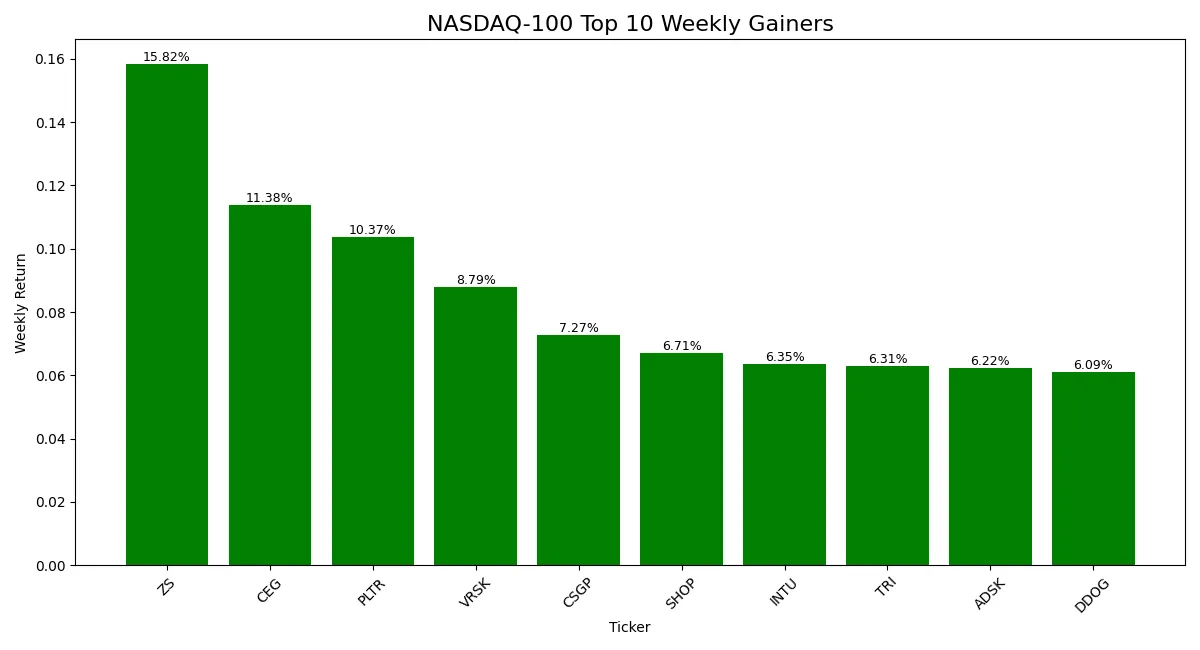
ZS led the gainers this week with a +15.82% increase. The Computer Software sector was most represented with 6 entries. Average gain among top performers was +8.53%.
| Ticker | Company name | Sector | Start date | End date | Start close | End close | Weekly Return (%) |
|---|---|---|---|---|---|---|---|
| ZS | Zscaler | EDP Services | 2026-10-05 | 2026-10-09 | 201.80 | 233.73 | +15.82% |
| CEG | Constellation Energy | Electric Utilities | 2026-10-05 | 2026-10-09 | 267.62 | 298.07 | +11.38% |
| PLTR | Palantir Technologies | Computer Software | 2026-10-05 | 2026-10-09 | 189.40 | 209.05 | +10.37% |
| VRSK | Verisk Analytics | Diversified Commercial Services | 2026-10-05 | 2026-10-09 | 163.28 | 177.63 | +8.79% |
| CSGP | CoStar Group | Real Estate | 2026-10-05 | 2026-10-09 | 27.66 | 29.67 | +7.27% |
| SHOP | Shopify | Computer Software | 2026-10-05 | 2026-10-09 | 160.11 | 170.85 | +6.71% |
| INTU | Intuit | Computer Software | 2026-10-05 | 2026-10-09 | 284.68 | 302.75 | +6.35% |
| TRI | Thomson Reuters | Computer Software | 2026-10-05 | 2026-10-09 | 97.08 | 103.21 | +6.31% |
| ADSK | Autodesk | Computer Software | 2026-10-05 | 2026-10-09 | 221.56 | 235.35 | +6.22% |
| DDOG | Datadog | Computer Software | 2026-10-05 | 2026-10-09 | 276.42 | 293.26 | +6.09% |
📈 NASDAQ 100 Weekly Top 10 Gainers Chart
Performance comparison of stocks with highest weekly returns in NASDAQ 100
📈 Data Source: NASDAQ 100 Market Data • 📅 Generated: October 16, 2026 • 🔄 Updated: 08:56 UTC
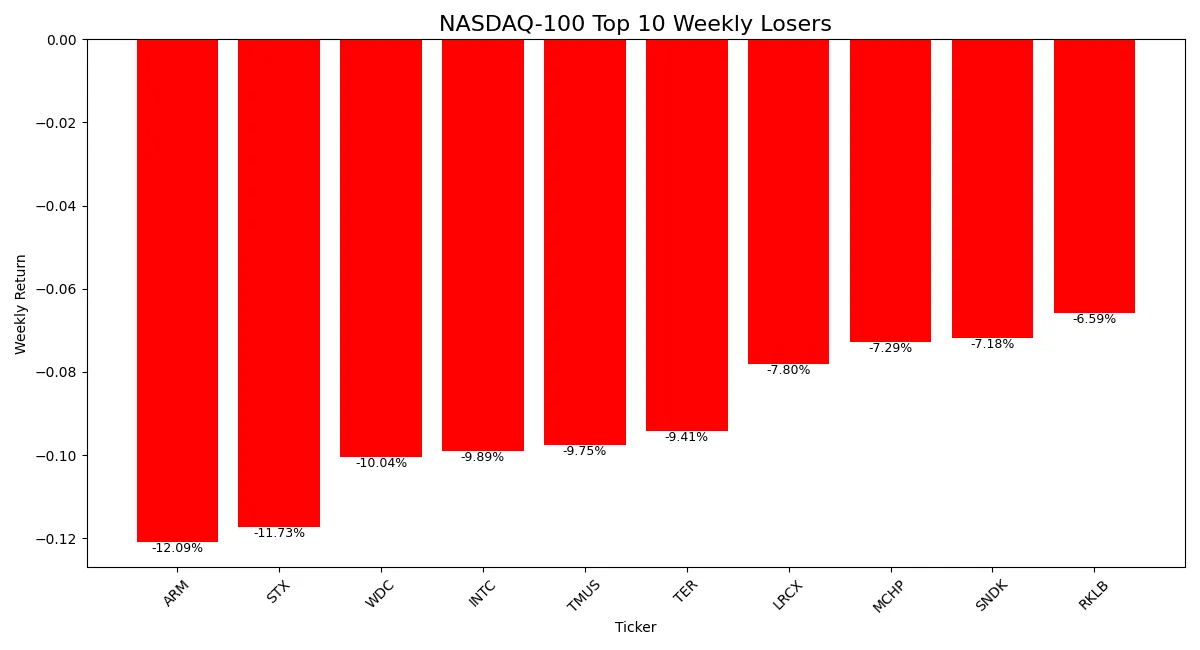
📉 NASDAQ 100 Weekly Top 10 Losers
ARM led the losers this week with a -12.09% decline. The Semiconductors sector was most represented with 4 entries. Average loss among top performers was 9.18%.
| Ticker | Company name | Sector | Start date | End date | Start close | End close | Weekly Return (%) |
|---|---|---|---|---|---|---|---|
| ARM | Arm Holdings | Semiconductors | 2026-10-05 | 2026-10-09 | 302.90 | 266.28 | -12.09% |
| STX | Seagate Technology | Electronic Components | 2026-10-05 | 2026-10-09 | 887.09 | 783.00 | -11.73% |
| WDC | Western Digital | Electronic Components | 2026-10-05 | 2026-10-09 | 441.64 | 397.28 | -10.04% |
| INTC | Intel | Semiconductors | 2026-10-05 | 2026-10-09 | 116.19 | 104.70 | -9.89% |
| TMUS | T-Mobile US | Telecommunications Service Providers | 2026-10-05 | 2026-10-09 | 164.64 | 148.58 | -9.75% |
| TER | Teradyne | Semiconductors | 2026-10-05 | 2026-10-09 | 444.53 | 402.68 | -9.41% |
| LRCX | Lam Research | Industrial Machinery | 2026-10-05 | 2026-10-09 | 345.80 | 318.84 | -7.80% |
| MCHP | Microchip Technology | Semiconductors | 2026-10-05 | 2026-10-09 | 81.49 | 75.55 | -7.29% |
| SNDK | Sandisk | Electronic Components | 2026-10-05 | 2026-10-09 | 1,704.16 | 1,581.82 | -7.18% |
| RKLB | Rocket Lab | Aerospace | 2026-10-05 | 2026-10-09 | 73.02 | 68.21 | -6.59% |
📉 NASDAQ 100 Weekly Top 10 Losers Chart
Analysis of NASDAQ 100 stocks facing maximum weekly decline
📈 Data Source: NASDAQ 100 Market Data • 📅 Generated: October 16, 2026 • 🔄 Updated: 08:56 UTC
📊 NASDAQ 100 P/E Ratio Analysis
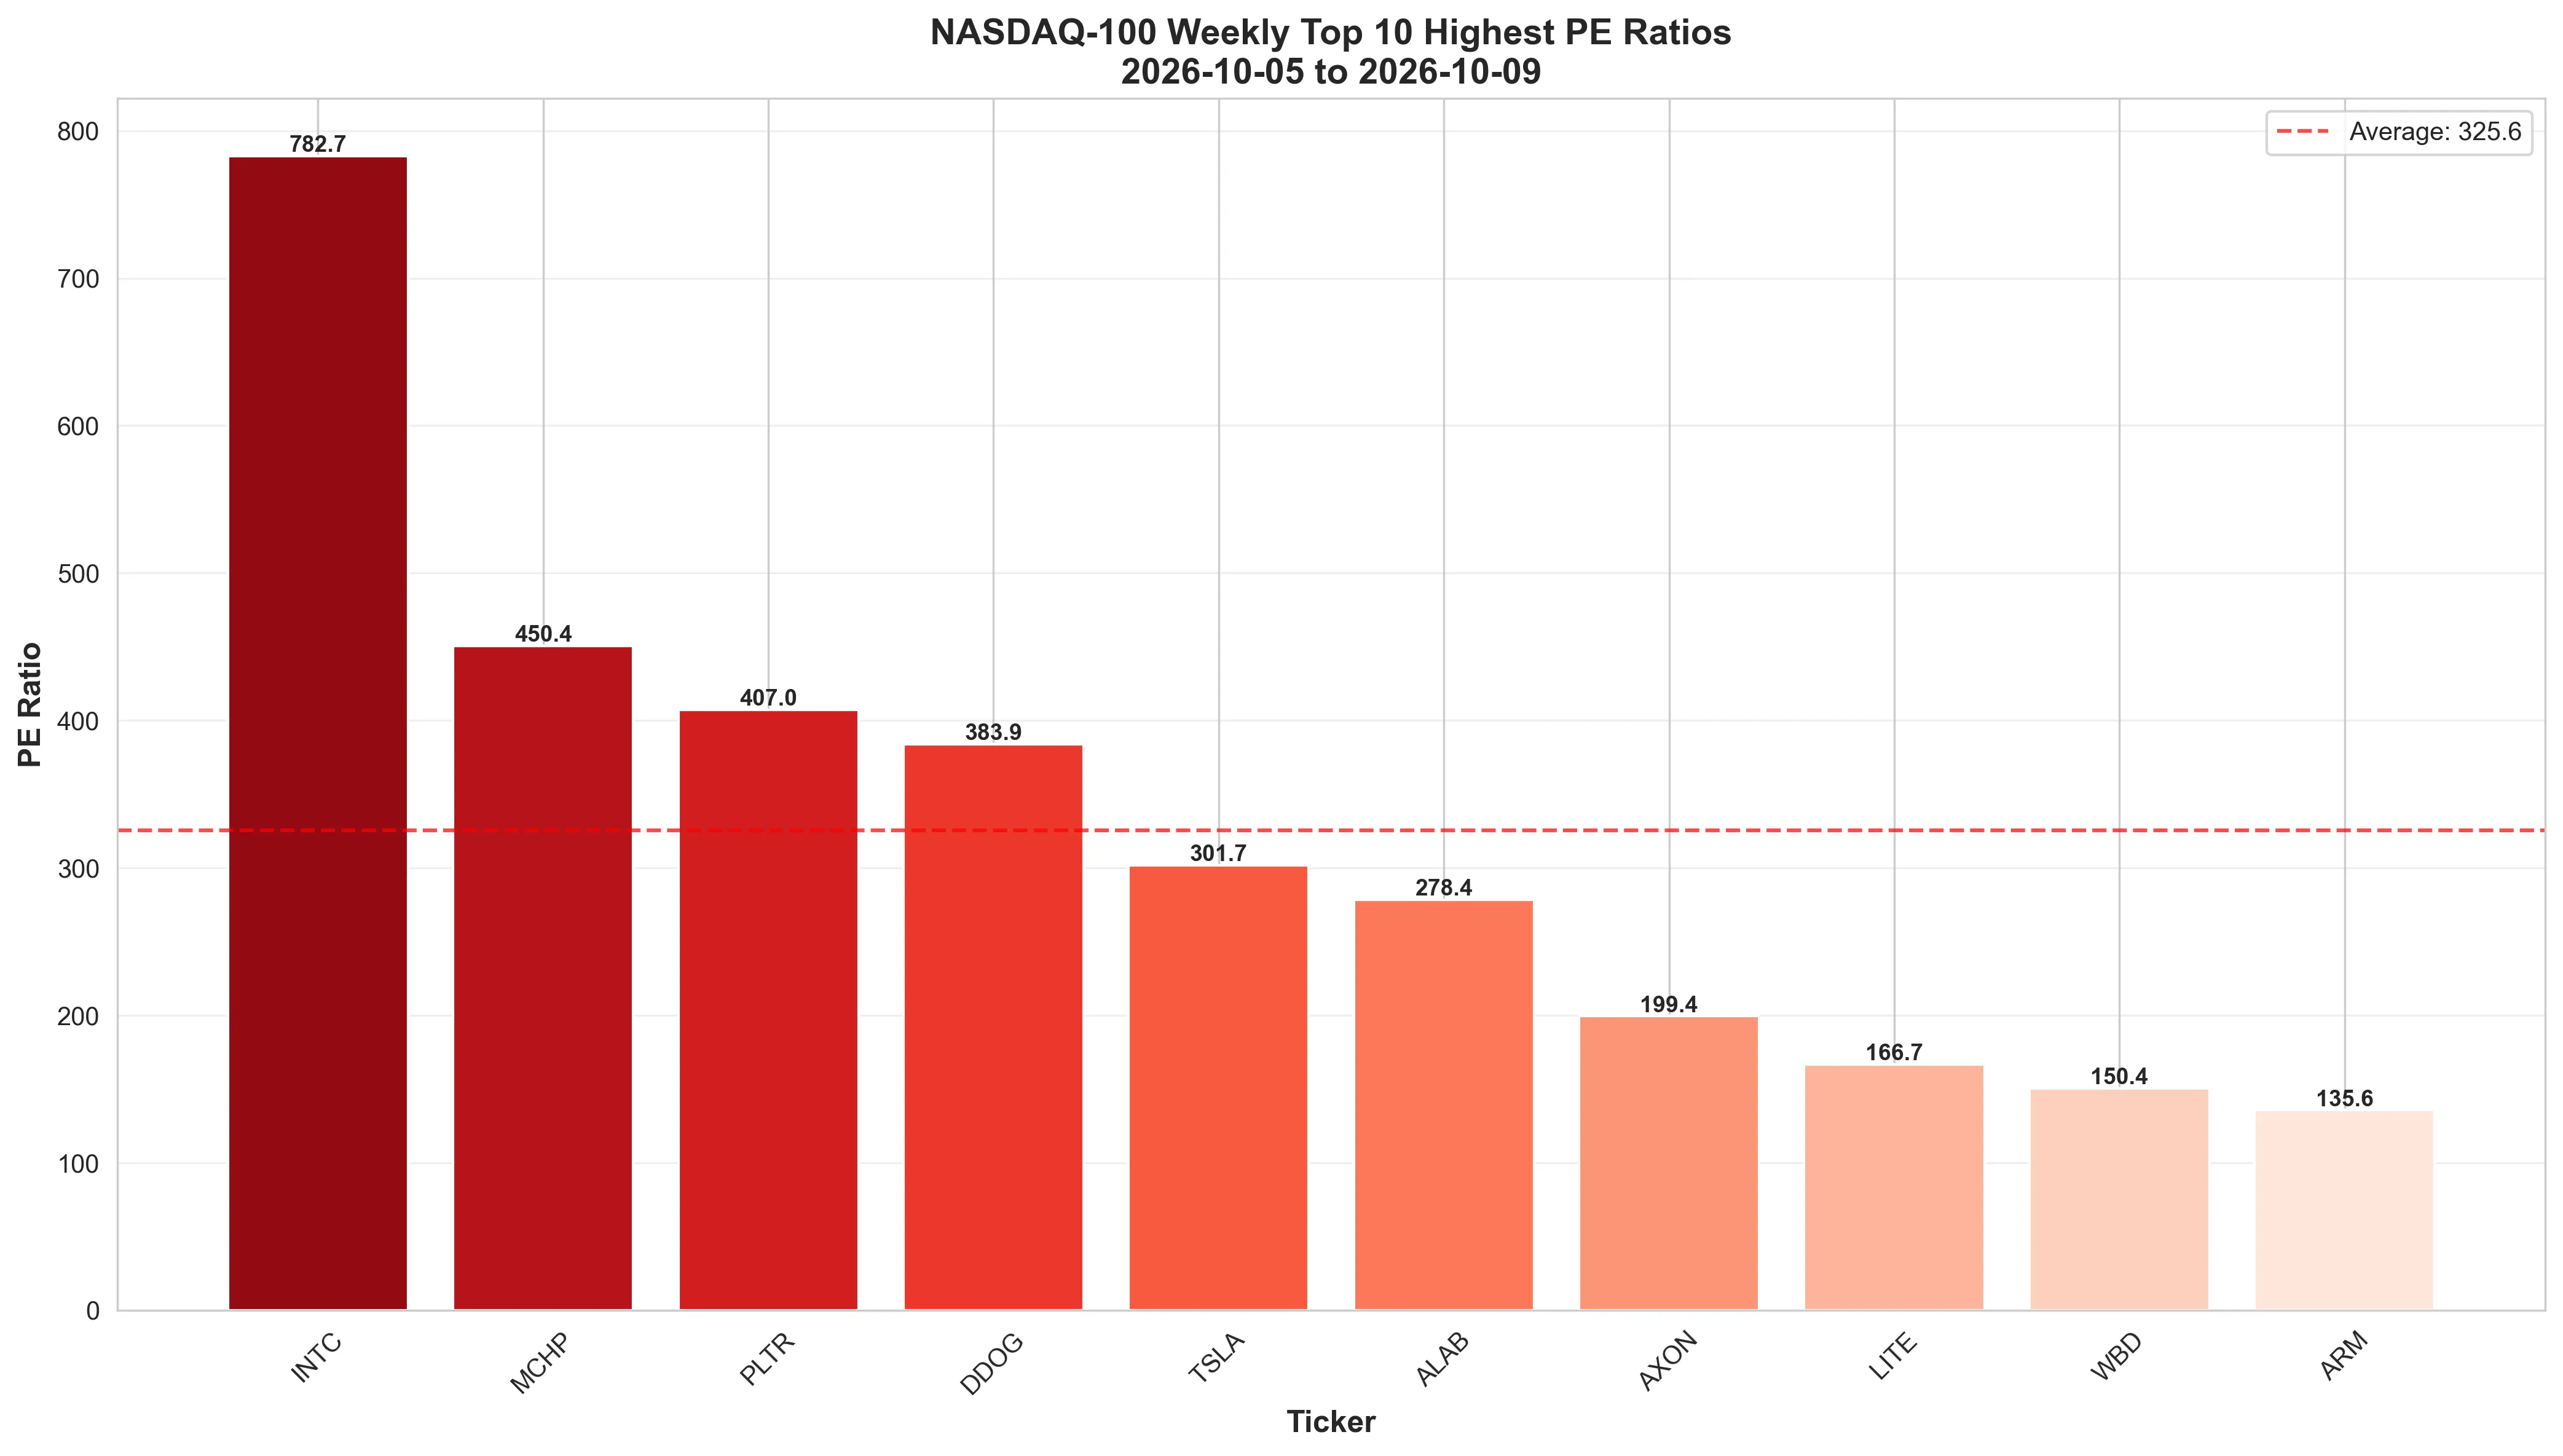
Highest P/E Ratios
| Ticker | Company name | Sector | Industry | Pe ratio | Weekly close | Weekly change | Market cap formatted | Report period | Report date |
|---|---|---|---|---|---|---|---|---|---|
| INTC | Intel | Technology | Semiconductors | 782.7x | 104.70 | -9.41% | $224.00B | 2026-10-05 to 2026-10-09 | 2026-10-10 |
| MCHP | Microchip Technology | Technology | Semiconductors | 450.4x | 75.55 | -6.68% | $40.37B | 2026-10-05 to 2026-10-09 | 2026-10-10 |
| PLTR | Palantir Technologies | Technology | Software - Infrastructure | 407.0x | 209.05 | +10.52% | $407.47B | 2026-10-05 to 2026-10-09 | 2026-10-10 |
| DDOG | Datadog | Technology | Software - Application | 383.9x | 293.26 | +5.56% | $41.74B | 2026-10-05 to 2026-10-09 | 2026-10-10 |
| TSLA | Tesla, Inc. | Consumer Cyclical | Auto Manufacturers | 301.7x | 382.70 | +3.77% | $1455.05B | 2026-10-05 to 2026-10-09 | 2026-10-10 |
| ALAB | Astera Labs | Technology | Semiconductors | 278.4x | 342.21 | -3.55% | $69.66B | 2026-10-05 to 2026-10-09 | 2026-10-10 |
| AXON | Axon Enterprise | Industrials | Aerospace & Defense | 199.4x | 422.89 | +2.64% | $50.53B | 2026-10-05 to 2026-10-09 | 2026-10-10 |
| LITE | Lumentum | Technology | Communication Equipment | 166.7x | 1,103.35 | +1.01% | $73.67B | 2026-10-05 to 2026-10-09 | 2026-10-10 |
| WBD | Warner Bros. Discovery | Communication Services | Entertainment | 150.4x | 30.95 | 0.00% | $70.86B | 2026-10-05 to 2026-10-09 | 2026-10-10 |
| ARM | Arm Holdings | Technology | Semiconductors | 135.6x | 266.28 | -13.37% | $112.23B | 2026-10-05 to 2026-10-09 | 2026-10-10 |
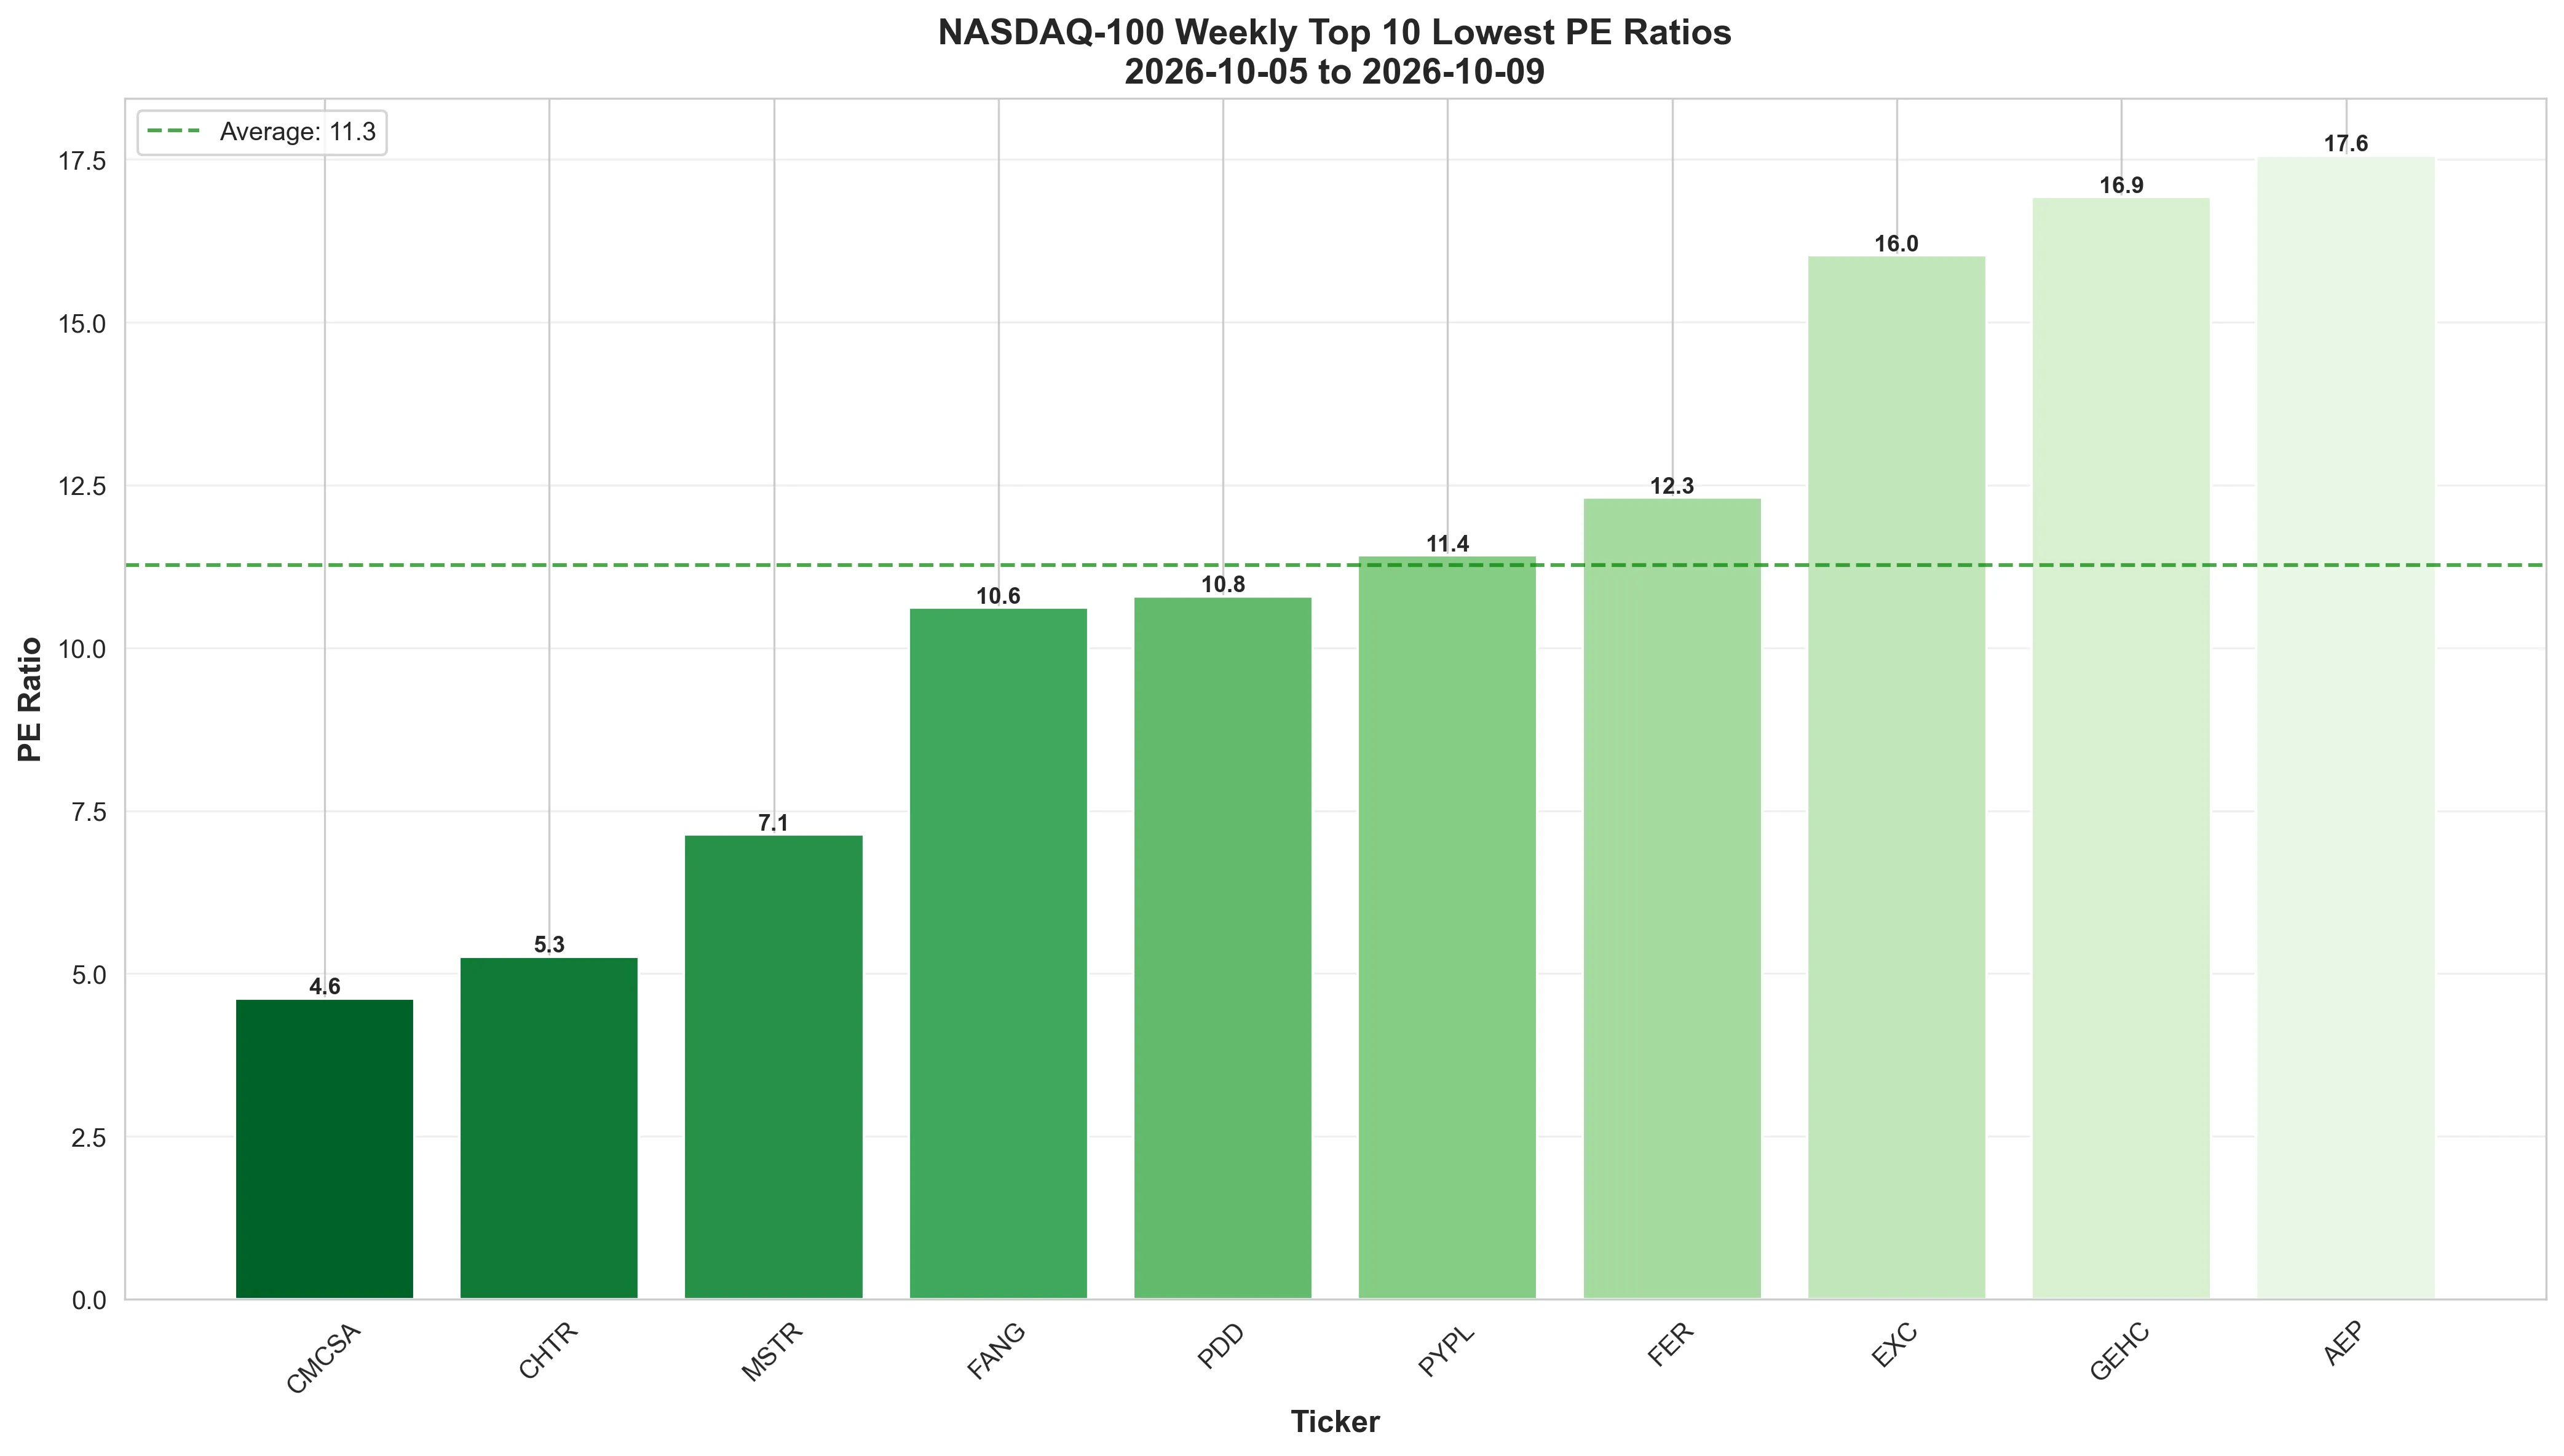
Lowest P/E Ratios
| Ticker | Company name | Sector | Industry | Pe ratio | Weekly close | Weekly change | Market cap formatted | Report period | Report date |
|---|---|---|---|---|---|---|---|---|---|
| CMCSA | Comcast | Communication Services | Telecom Services | 4.6x | 20.66 | -4.22% | $109.64B | 2026-10-05 to 2026-10-09 | 2026-10-10 |
| CHTR | Charter Communications | Communication Services | Telecom Services | 5.3x | 103.38 | -5.23% | $25.92B | 2026-10-05 to 2026-10-09 | 2026-10-10 |
| MSTR | MicroStrategy | Technology | Software - Application | 7.1x | 154.34 | -6.28% | $50.26B | 2026-10-05 to 2026-10-09 | 2026-10-10 |
| FANG | Diamondback Energy | Energy | Oil & Gas E&P | 10.6x | 192.13 | +4.44% | $43.79B | 2026-10-05 to 2026-10-09 | 2026-10-10 |
| PDD | PDD Holdings | Consumer Cyclical | Internet Retail | 10.8x | 81.35 | +7.52% | $151.56B | 2026-10-05 to 2026-10-09 | 2026-10-10 |
| PYPL | PayPal | Financial Services | Credit Services | 11.4x | 55.53 | +5.79% | $54.35B | 2026-10-05 to 2026-10-09 | 2026-10-10 |
| FER | Ferrovial | Industrials | Engineering & Construction | 12.3x | 50.15 | -3.56% | $48.78B | 2026-10-05 to 2026-10-09 | 2026-10-10 |
| EXC | Exelon | Utilities | Utilities - Regulated Electric | 16.0x | 41.76 | +2.81% | $45.18B | 2026-10-05 to 2026-10-09 | 2026-10-10 |
| GEHC | GE HealthCare | Healthcare | Medical Devices | 16.9x | 65.74 | +3.36% | $37.32B | 2026-10-05 to 2026-10-09 | 2026-10-10 |
| AEP | American Electric Power | Utilities | Utilities - Regulated Electric | 17.6x | 122.81 | +2.80% | $64.21B | 2026-10-05 to 2026-10-09 | 2026-10-10 |
Highest P/E Ratio Visualization
📈 NASDAQ 100 Highest P/E Ratios Visualization
Analysis of growth stocks trading at premium valuations in the technology-focused index
📊 NASDAQ 100 P/E Analysis • 📅 Generated: October 16, 2026 • 🔄 Updated: 08:56 UTC
Lowest P/E Ratio Visualization
📉 NASDAQ 100 Lowest P/E Ratios Visualization
Value-oriented tech stocks analysis highlighting conservative earnings multiples
📊 NASDAQ 100 P/E Analysis • 📅 Generated: October 16, 2026 • 🔄 Updated: 08:56 UTC
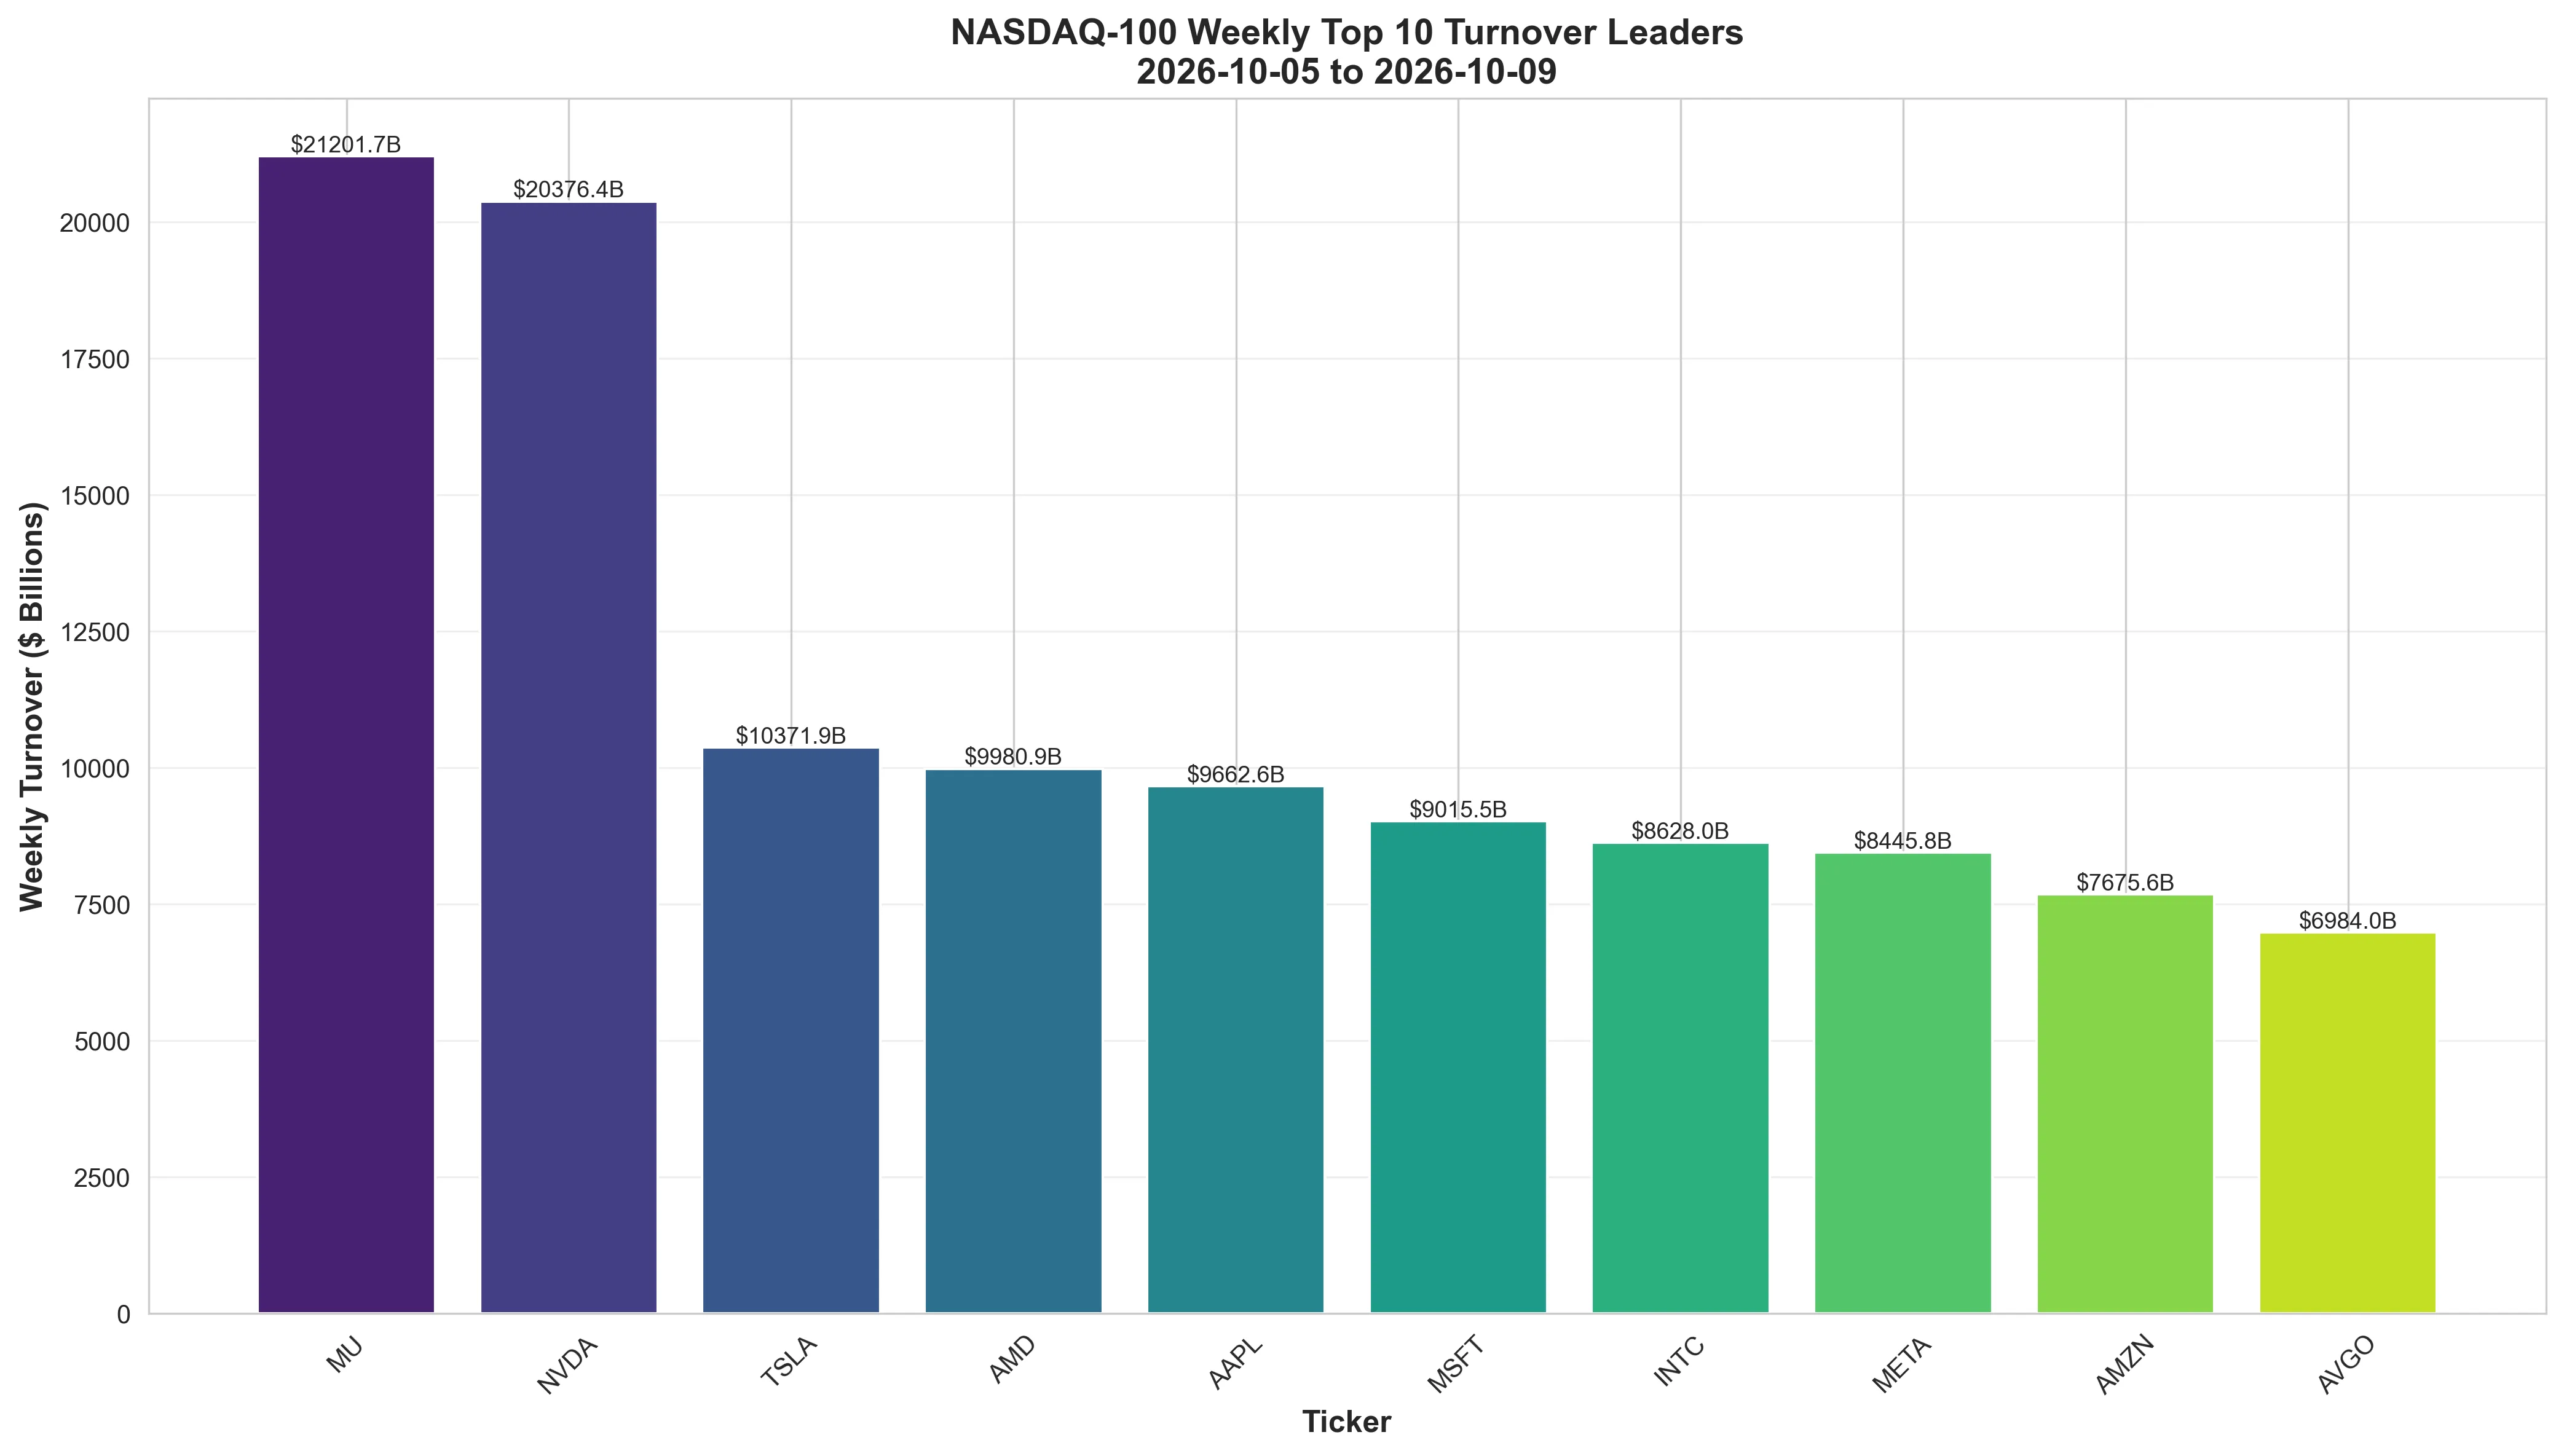
⚡ NASDAQ 100 Turnover Leaders
🔥 NASDAQ 100 trading activity reached intense levels this week! MU dominated with $21,202B in turnover, closely followed by MU, NVDA, TSLA as technology investors aggressively repositioned. The Technology sector led with 7 of the top 10 spots, showcasing where institutional capital is most active in the tech-heavy index. Average turnover across leaders reached $11,234.2 billion, signaling exceptional liquidity that supports large tech allocations but also indicates potential volatility ahead. High turnover in growth-oriented tech names often precedes significant price discovery as earnings expectations are tested.
| Ticker | Company name | Sector | Industry | Weekly turnover | Turnover formatted | Weekly volume | Weekly close | Weekly change | Market cap formatted | Report period | Report date |
|---|---|---|---|---|---|---|---|---|---|---|---|
| MU | Micron Technology | Technology | Semiconductors | $21.20T | $21201.69B | 20,112,557,504.00 | 1,029.00 | -3.79% | $408.28B | 2026-10-05 to 2026-10-09 | 2026-10-10 |
| NVDA | Nvidia | Technology | Semiconductors | $20.38T | $20376.37B | 86,345,955,228.00 | 229.28 | -2.88% | $4534.14B | 2026-10-05 to 2026-10-09 | 2026-10-10 |
| TSLA | Tesla, Inc. | Consumer Cyclical | Auto Manufacturers | $10.37T | $10371.86B | 27,421,119,843.00 | 382.70 | +3.77% | $1455.05B | 2026-10-05 to 2026-10-09 | 2026-10-10 |
| AMD | Advanced Micro Devices | Technology | Semiconductors | $9.98T | $9980.88B | 15,772,729,271.00 | 608.10 | -3.53% | $377.43B | 2026-10-05 to 2026-10-09 | 2026-10-10 |
| AAPL | Apple Inc. | Technology | Consumer Electronics | $9.66T | $9662.63B | 28,802,613,385.00 | 336.64 | +1.16% | $3775.80B | 2026-10-05 to 2026-10-09 | 2026-10-10 |
| MSFT | Microsoft | Technology | Software - Infrastructure | $9.02T | $9015.52B | 17,054,161,293.00 | 535.07 | +2.54% | $3418.22B | 2026-10-05 to 2026-10-09 | 2026-10-10 |
| INTC | Intel | Technology | Semiconductors | $8.63T | $8628.02B | 77,417,461,472.00 | 104.70 | -9.41% | $224.00B | 2026-10-05 to 2026-10-09 | 2026-10-10 |
| META | Meta Platforms | Communication Services | Internet Content & Information | $8.45T | $8445.80B | 11,584,811,420.00 | 718.67 | -1.19% | $1563.36B | 2026-10-05 to 2026-10-09 | 2026-10-10 |
| AMZN | Amazon | Consumer Cyclical | Internet Retail | $7.68T | $7675.56B | 29,976,026,522.00 | 262.43 | +4.90% | $2556.24B | 2026-10-05 to 2026-10-09 | 2026-10-10 |
| AVGO | Broadcom | Technology | Semiconductors | $6.98T | $6984.01B | 19,011,979,649.00 | 361.54 | +1.05% | $1667.55B | 2026-10-05 to 2026-10-09 | 2026-10-10 |
Weekly Performance Visualization
Graphical representation of weekly market data
📈 Data Source: NASDAQ 100 Market Data • 📅 Generated: October 16, 2026 • 🔄 Updated: 08:56 UTC
📋 NASDAQ 100 Weekly Summary & Investor Takeaways (2026-10-05 - 2026-10-09)
📊 Weekly Performance Snapshot
- NASDAQ 100 Weekly Return: +0.24%
- NASDAQ 100 Opening: 30,807.93
- NASDAQ 100 Closing: 30,883.15
- Top Gainer: ZS (+15.82%)
- Average Top 10 Gain: +8.53%
- Top Loser: ARM (-12.09%)
- Average Top 10 Loss: -9.18%
- Best Performing Sector: Electric Utilities (+11.3800%)
- Worst Performing Sector: Telecommunications Service Providers (-9.7500%)
🎯 Key Market Observations
Consolidation Phase: NASDAQ 100 showed healthy consolidation after recent moves. Sector Concentration: Computer Software dominated with 6 stocks in top 10, indicating focused institutional interest.
💡 Investor Takeaways & Strategic Insights
- Growth Focus: NASDAQ 100 is technology-heavy - focus on companies with sustainable growth, strong moats, and innovation pipelines. Monitor earnings quality and guidance.
- Sector Rotation: Be aware of rotation between technology sub-sectors (software, semiconductors, internet). Consider thematic exposure to emerging tech trends.
- Volatility Management: NASDAQ 100 is more volatile than broader indices. Use appropriate position sizing, consider options for hedging, and maintain cash for opportunities.
- Earnings Sensitivity: Tech stocks are highly sensitive to earnings reports. Focus on companies with consistent execution and positive guidance revisions.
- Long-term Themes: Align with secular trends like cloud computing, AI, digital transformation, and cybersecurity while being selective on valuations.
Disclaimer: This analysis is for informational purposes only. NASDAQ 100 is technology-heavy and more volatile than broader indices. Past performance does not guarantee future results. Always conduct your own research and consult with financial advisors before making investment decisions.
Important Links:
NASDAQ Post IPO Performance Reality (2023–2025)
S&P 500 Market Analysis Dashboard
SP 500 Main Financial Performance Dashboard
SP500 Stocks’ price closer to 52week’s high
⚠️ Important Investment Disclaimer
Risk Warning: All investment analysis, market commentary, and trading ideas provided on this website are for educational and informational purposes only. They do not constitute financial advice, investment recommendations, or solicitations to buy or sell any securities.
Stock market investments are subject to market risks. Past performance does not guarantee future results. You should consult with qualified financial advisors and conduct your own research before making any investment decisions. The authors and website owners are not responsible for any financial losses resulting from actions taken based on the information provided.
Source: S&P 500 Weekly Data | Compiled by-Md Kollol Hossain, CEO, CapitalinsightBD
The NASDAQ 100 index edged higher by 75.22 points (+0.24%) this week, reflecting positive sentiment in the technology-heavy index.