

The S&P 500 Weekly Market Pulse provides a comprehensive snapshot of U.S. equity market performance, combining index movement, sector rotation, stock-level gainers and losers, market breadth, and macroeconomic context into one structured weekly analysis. This page delivers data-driven insights covering weekly index returns, sector leadership and laggards, top-performing and underperforming stocks, investor sentiment, and Federal Reserve economic indicators, helping investors, traders, and analysts evaluate short-term trends within the broader market landscape. Designed for consistency and clarity, this weekly report serves as a reliable reference for monitoring market momentum, identifying emerging opportunities, and supporting informed investment decisions in the S&P 500 universe.
Watch This Week’s S&P 500 Market Breakdown
Prefer watching instead of reading? In just a few minutes, this video explains the biggest market movers, sector rotation, and key events that shaped the S&P 500 during this week. Click Play below for a quick, easy-to-follow weekly market recap.
S&P 500 Weekly Market Overview (2026-10-05 - 2026-10-09)
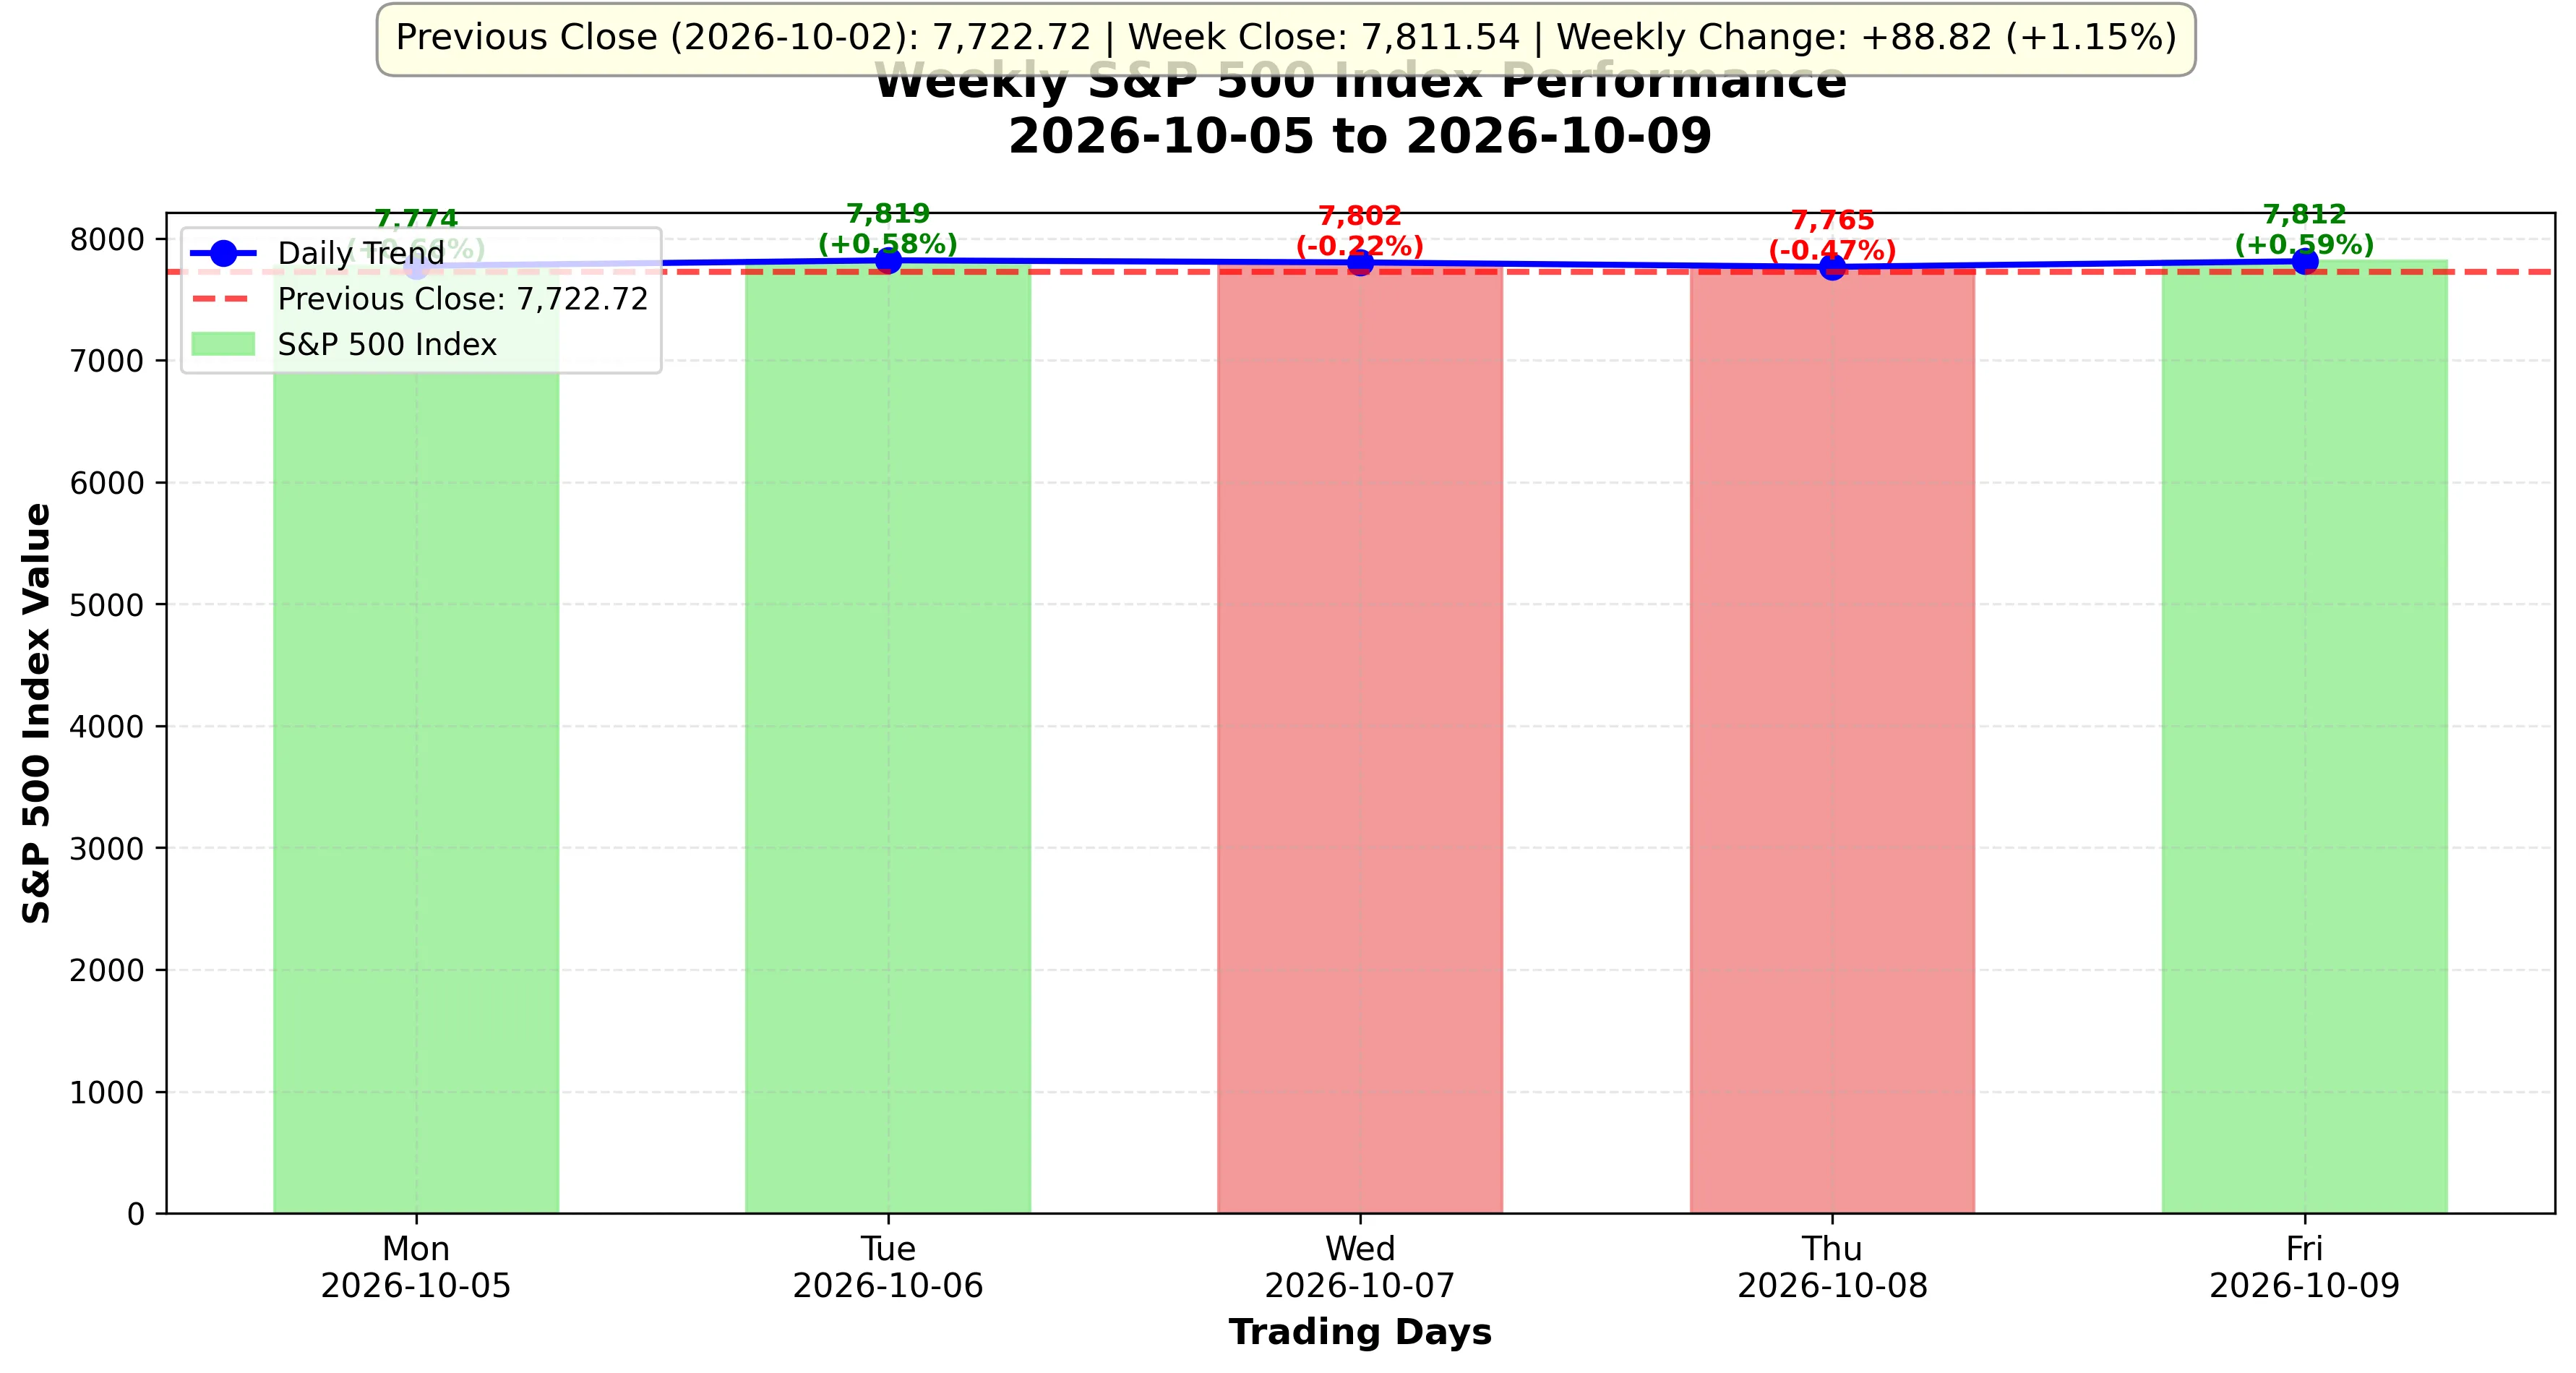
The S&P 500 index gained 88.82 points (+1.15%) this week, opening at 7,722.72 and closing at 7,811.54, reflecting positive investor sentiment amid evolving market conditions. Market sentiment was mixed, indicating consolidation and sector rotation. Market breadth showed Trading patterns indicated selective accumulation in quality names while profit-booking continued in extended positions.
Market Context: This weekly analysis provides comprehensive insights into index performance, sector rotation patterns, and individual stock leaders to inform your market perspective and investment decisions.
📈 S&P 500 Weekly Index Movement
The S&P 500 index gained 88.82 points (+1.15%) this week, reflecting positive investor sentiment amid evolving market conditions.
| Date | S&P 500 Close | Point Change | Daily Return % | Point Change From Start | Cumulative Return % |
|---|---|---|---|---|---|
| 2026-10-02 | 7,722.72 | 0.00 | 0.00% | 0.00 | 0.00% |
| 2026-10-05 | 7,773.95 | +51.23 | +0.66% | +51.23 | +0.66% |
| 2026-10-06 | 7,818.93 | +44.98 | +0.58% | +96.21 | +1.25% |
| 2026-10-07 | 7,801.77 | -17.16 | -0.22% | +79.05 | +1.02% |
| 2026-10-08 | 7,765.36 | -36.41 | -0.47% | +42.64 | +0.55% |
| 2026-10-09 | 7,811.54 | +46.18 | +0.59% | +88.82 | +1.15% |
📊 S&P 500 Index Weekly Performance Chart
Visual analysis of S&P 500 index fluctuations throughout the trading week
📈 Data Source: S&P 500 Market Data • 📅 Generated: October 16, 2026 • 🔄 Updated: 07:00 UTC
🏆 S&P 500 Weekly Sector Gainers
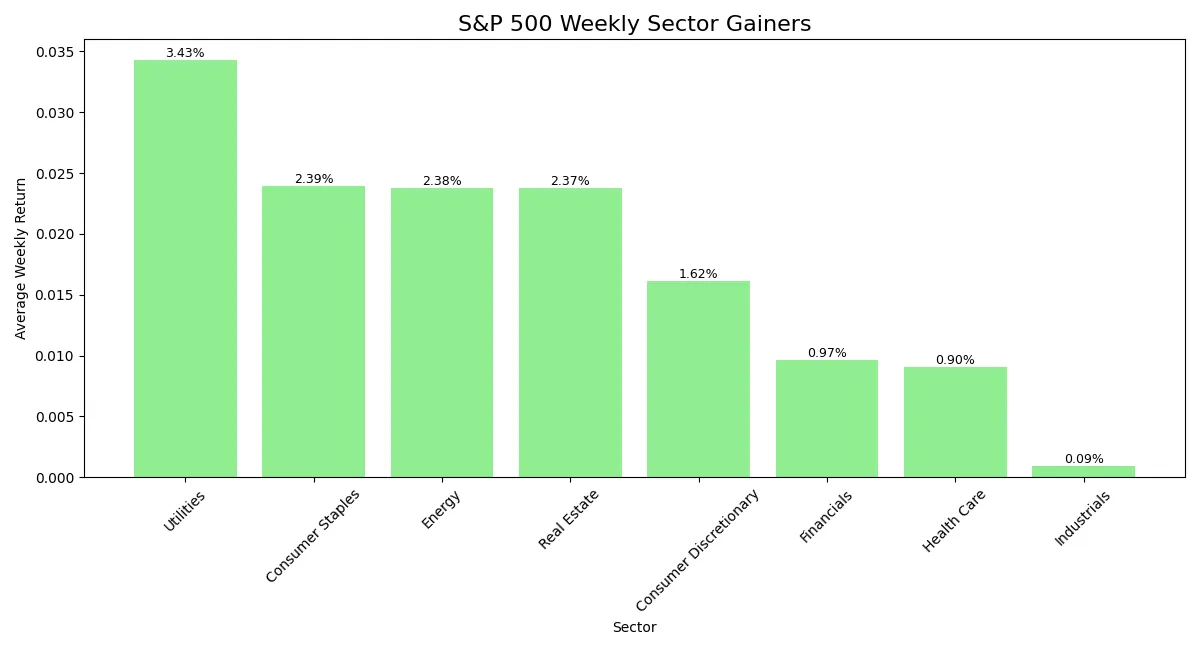
The Utilities sector led the gainers this week with a +3.4284% gain. Complete sector performance is detailed in the table below.
| Sector | Weekly Return (%) |
|---|---|
| Utilities | +3.43% |
| Consumer Staples | +2.39% |
| Energy | +2.38% |
| Real Estate | +2.37% |
| Consumer Discretionary | +1.62% |
| Financials | +0.97% |
| Health Care | +0.90% |
| Industrials | +0.09% |
🏆 S&P 500 Weekly Sector Gainers Chart
Sector-wise performance analysis showing weekly market leaders
📈 Data Source: S&P 500 Market Data • 📅 Generated: October 16, 2026 • 🔄 Updated: 07:00 UTC
🏭 S&P 500 Weekly Sector Losers
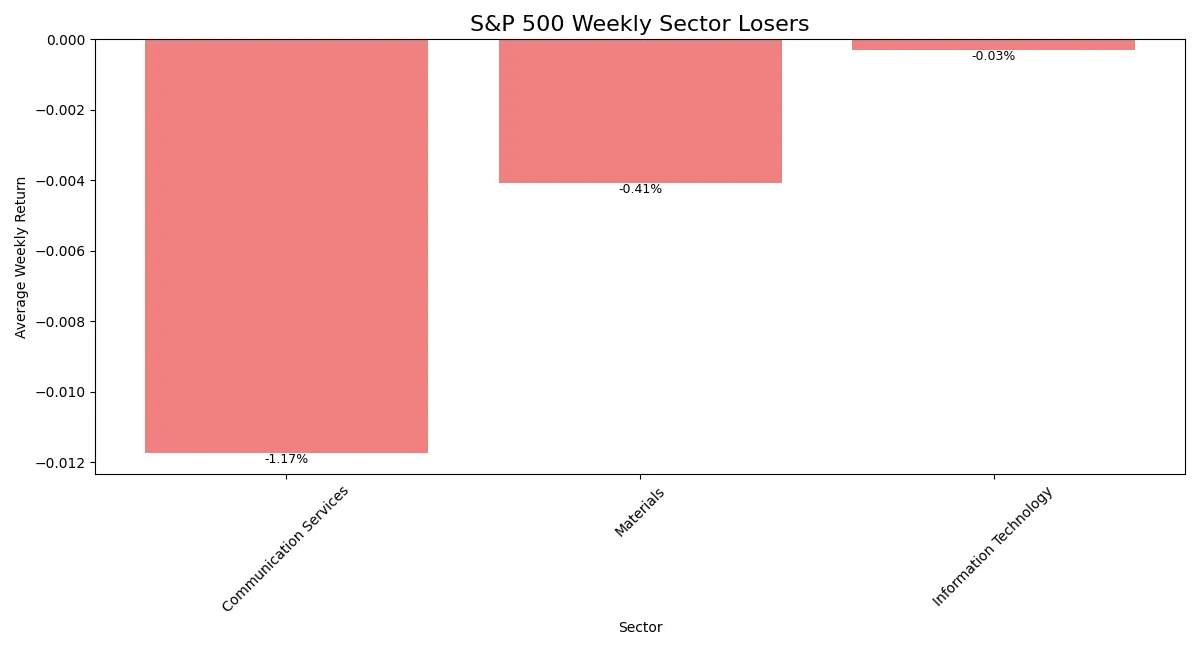
The Communication Services sector led the decliners this week with a -1.1748% loss. Complete sector performance is detailed in the table below.
| Sector | Weekly Return (%) |
|---|---|
| Communication Services | -1.17% |
| Materials | -0.41% |
| Information Technology | -0.03% |
🏭 S&P 500 Weekly Sector Losers Chart
Sector analysis highlighting areas of weekly weakness in the market
📈 Data Source: S&P 500 Market Data • 📅 Generated: October 16, 2026 • 🔄 Updated: 07:00 UTC
📊 S&P 500 Sector P/E Ratios
Sector Valuation Analysis:
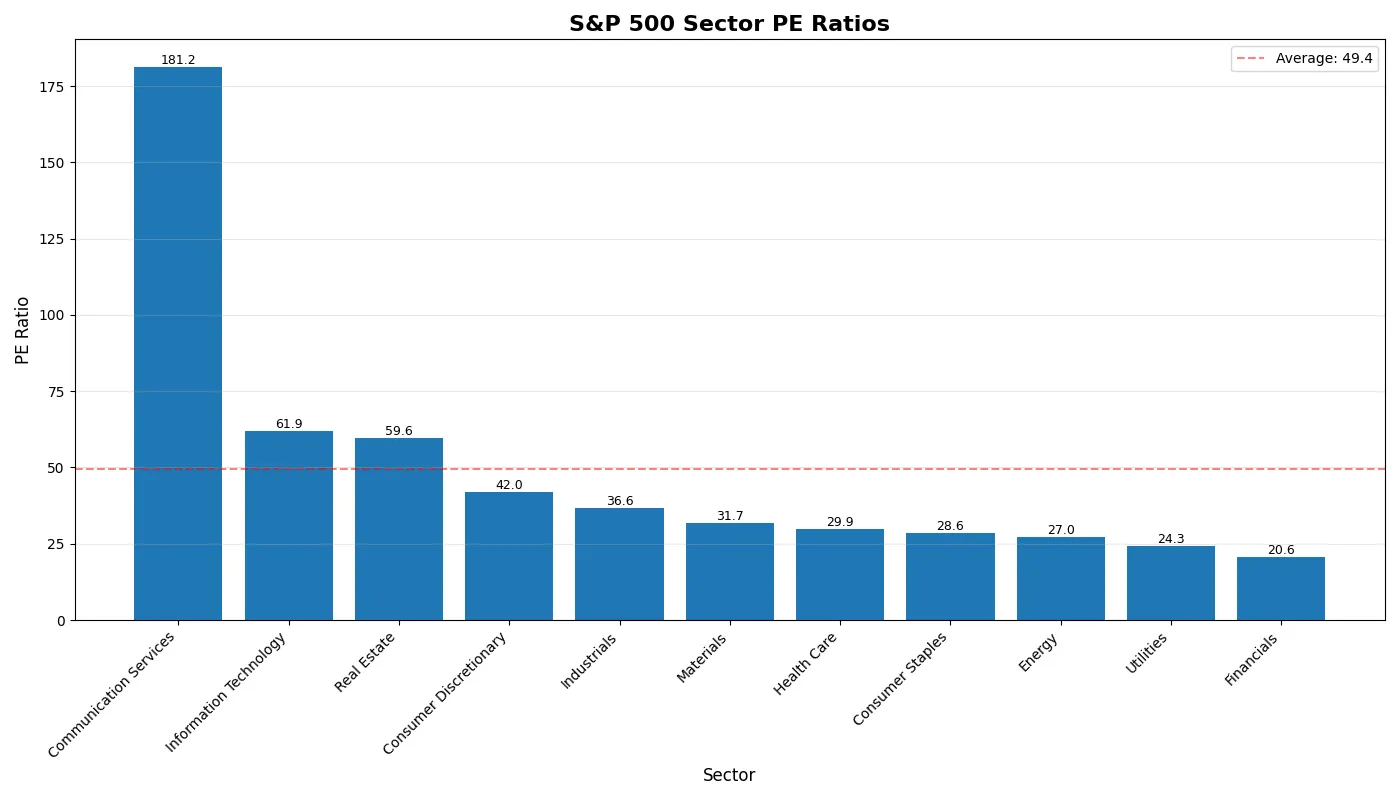
- Highest P/E Sector: Communication Services with P/E of 181.2x
- Lowest P/E Sector: Financials with P/E of 20.6x
- Average Sector P/E: 49.4x
Insights: Higher P/E ratios typically indicate sectors with strong growth expectations, while lower P/E sectors may offer value opportunities or face market challenges.
Sector P/E Ratio Chart
📊 Sector P/E Ratios
Visual comparison of sector valuation multiples showing highest and lowest P/E ratios across S&P 500 sectors.
📊 Sector P/E Analysis • 📅 Generated: October 16, 2026 • 🔄 Updated: 07:00 UTC
Sector P/E Ratio Details
| Rank | Sector | P/E Ratio | Valuation |
|---|---|---|---|
| 1 | Communication Services | 181.23x | High |
| 2 | Information Technology | 61.9x | High |
| 3 | Real Estate | 59.59x | High |
| 4 | Consumer Discretionary | 42.03x | High |
| 5 | Industrials | 36.58x | High |
| 6 | Materials | 31.75x | High |
| 7 | Health Care | 29.91x | Above Avg |
| 8 | Consumer Staples | 28.56x | Above Avg |
| 9 | Energy | 27.05x | Above Avg |
| 10 | Utilities | 24.27x | Above Avg |
| 11 | Financials | 20.62x | Above Avg |
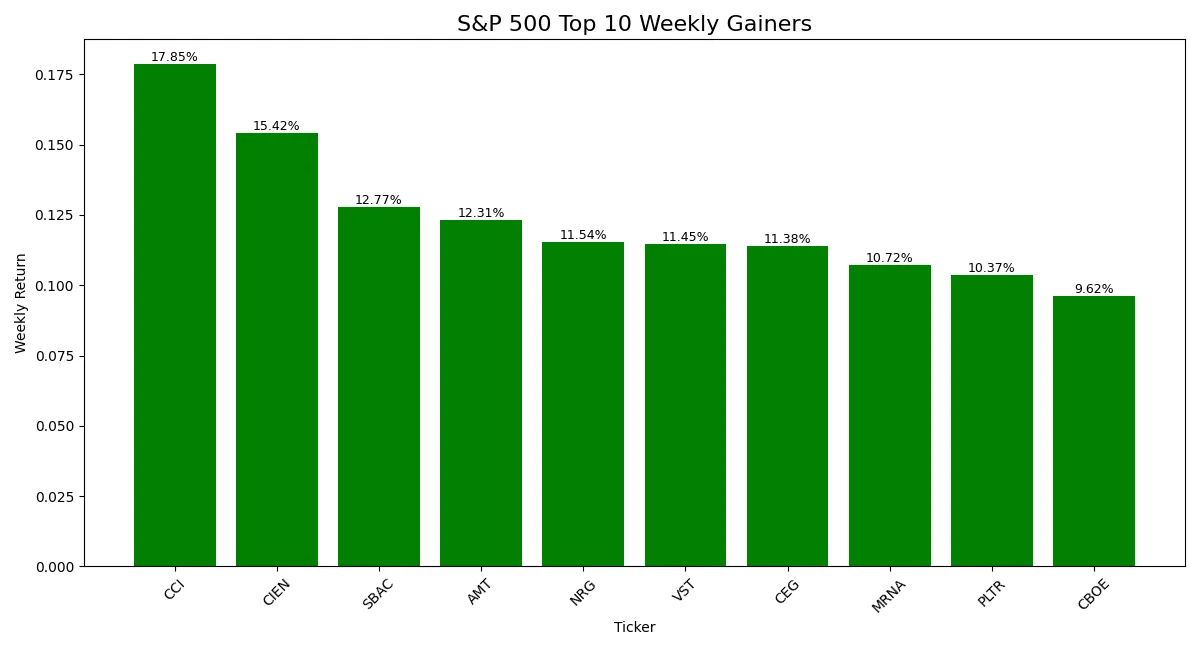
📈 S&P 500 Weekly Top 10 Gainers
CCI led the gainers this week with a +17.85% increase. The Real Estate sector was most represented with 3 entries. Average gain among top performers was +12.34%.
| Ticker | Company name | Sector | Weekly Return (%) | Start of week price | End of week price | Weekly low | Weekly low date | Weekly high | Weekly high date |
|---|---|---|---|---|---|---|---|---|---|
| CCI | Crown Castle | Real Estate | +17.85% | 67.58 | 79.64 | 67.58 | 2026-10-05 | 79.64 | 2026-10-09 |
| CIEN | Ciena | Information Technology | +15.42% | 389.69 | 449.77 | 389.69 | 2026-10-05 | 449.77 | 2026-10-09 |
| SBAC | SBA Communications | Real Estate | +12.77% | 161.82 | 182.49 | 161.82 | 2026-10-05 | 182.49 | 2026-10-09 |
| AMT | American Tower | Real Estate | +12.31% | 162.26 | 182.24 | 162.26 | 2026-10-05 | 182.24 | 2026-10-09 |
| NRG | NRG Energy | Utilities | +11.54% | 96.80 | 107.97 | 96.80 | 2026-10-05 | 108.61 | 2026-10-07 |
| VST | Vistra Corp. | Utilities | +11.45% | 144.89 | 161.48 | 144.89 | 2026-10-05 | 166.72 | 2026-10-07 |
| CEG | Constellation Energy | Utilities | +11.38% | 267.62 | 298.07 | 267.62 | 2026-10-05 | 300.40 | 2026-10-06 |
| MRNA | Moderna | Health Care | +10.72% | 203.21 | 225.00 | 187.46 | 2026-10-06 | 225.00 | 2026-10-09 |
| PLTR | Palantir Technologies | Information Technology | +10.37% | 189.40 | 209.05 | 189.40 | 2026-10-05 | 209.05 | 2026-10-09 |
| CBOE | Cboe Global Markets | Financials | +9.62% | 277.47 | 304.16 | 277.47 | 2026-10-05 | 304.16 | 2026-10-09 |
📈 S&P 500 Weekly Top 10 Gainers Chart
Performance comparison of stocks with highest weekly returns in the S&P 500
📈 Data Source: S&P 500 Market Data • 📅 Generated: October 16, 2026 • 🔄 Updated: 07:00 UTC
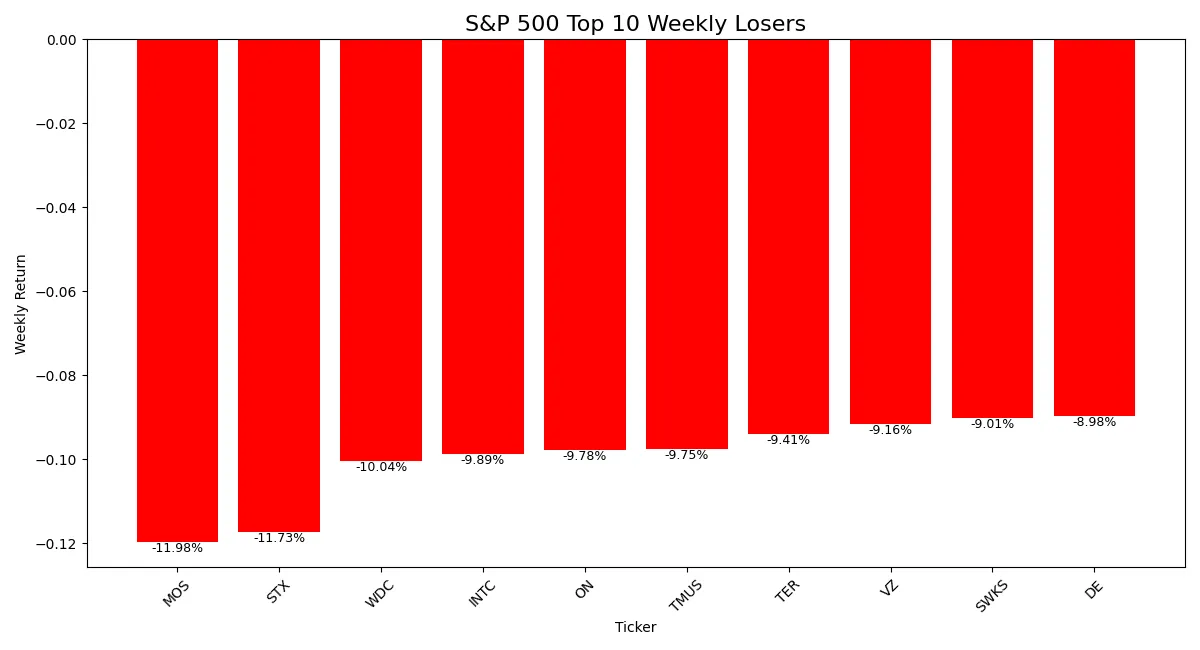
📉 S&P 500 Weekly Top 10 Losers
MOS led the losers this week with a -11.98% decline. The Information Technology sector was most represented with 6 entries. Average loss among top performers was 9.97%.
| Ticker | Company name | Sector | Weekly Return (%) | Start of week price | End of week price | Weekly low | Weekly low date | Weekly high | Weekly high date |
|---|---|---|---|---|---|---|---|---|---|
| MOS | Mosaic Company (The) | Materials | -11.98% | 21.29 | 18.74 | 18.74 | 2026-10-09 | 21.29 | 2026-10-05 |
| STX | Seagate Technology | Information Technology | -11.73% | 887.09 | 783.00 | 774.83 | 2026-10-08 | 887.09 | 2026-10-05 |
| WDC | Western Digital | Information Technology | -10.04% | 441.64 | 397.28 | 393.31 | 2026-10-08 | 441.64 | 2026-10-05 |
| INTC | Intel | Information Technology | -9.89% | 116.19 | 104.70 | 104.70 | 2026-10-09 | 116.19 | 2026-10-05 |
| ON | ON Semiconductor | Information Technology | -9.78% | 85.93 | 77.53 | 77.53 | 2026-10-09 | 86.31 | 2026-10-06 |
| TMUS | T-Mobile US | Communication Services | -9.75% | 164.64 | 148.58 | 148.58 | 2026-10-09 | 171.31 | 2026-10-08 |
| TER | Teradyne | Information Technology | -9.41% | 444.53 | 402.68 | 398.72 | 2026-10-08 | 444.53 | 2026-10-05 |
| VZ | Verizon | Communication Services | -9.16% | 45.85 | 41.65 | 41.65 | 2026-10-09 | 46.35 | 2026-10-08 |
| SWKS | Skyworks Solutions | Information Technology | -9.01% | 83.91 | 76.35 | 76.35 | 2026-10-09 | 83.91 | 2026-10-05 |
| DE | Deere & Company | Industrials | -8.98% | 682.20 | 620.93 | 620.93 | 2026-10-09 | 682.79 | 2026-10-06 |
📉 S&P 500 Weekly Top 10 Losers Chart
Analysis of S&P 500 stocks facing maximum weekly decline
📈 Data Source: S&P 500 Market Data • 📅 Generated: October 16, 2026 • 🔄 Updated: 07:00 UTC
📊 S&P 500 P/E Ratio Analysis
Highest P/E Ratios
| Ticker | Company name | Sector | Industry | P/E Ratio | Weekly close | Weekly change | Market cap formatted | Report period | Report date |
|---|---|---|---|---|---|---|---|---|---|
| CSGP | CoStar Group | Real Estate | Real Estate Services | 749.8x | 29.67 | +8.88% | $19.07B | 2026-10-05 to 2026-10-09 | 2026-10-10 |
| MCHP | Microchip Technology | Technology | Semiconductors | 450.4x | 75.55 | -6.68% | $42.51B | 2026-10-05 to 2026-10-09 | 2026-10-10 |
| PSKY | Paramount Skydance Corporation | Communication Services | Entertainment | 404.7x | 9.28 | +0.22% | $13.39B | 2026-10-05 to 2026-10-09 | 2026-10-10 |
| DDOG | Datadog | Technology | Software - Application | 403.9x | 293.26 | +5.56% | $43.90B | 2026-10-05 to 2026-10-09 | 2026-10-10 |
| TSLA | Tesla, Inc. | Consumer Cyclical | Auto Manufacturers | 383.0x | 382.70 | +3.77% | $1566.42B | 2026-10-05 to 2026-10-09 | 2026-10-10 |
| ALB | Albemarle Corporation | Basic Materials | Specialty Chemicals | 375.1x | 101.27 | -3.73% | $19.60B | 2026-10-05 to 2026-10-09 | 2026-10-10 |
| BE | Bloom Energy | Industrials | Electrical Equipment & Parts | 369.1x | 280.50 | -3.27% | $82.61B | 2026-10-05 to 2026-10-09 | 2026-10-10 |
| COHR | Coherent Corp. | Technology | Scientific & Technical Instruments | 331.8x | 312.62 | -8.30% | $64.68B | 2026-10-05 to 2026-10-09 | 2026-10-10 |
| CIEN | Ciena | Technology | Communication Equipment | 285.2x | 449.77 | +14.22% | $63.34B | 2026-10-05 to 2026-10-09 | 2026-10-10 |
| LITE | Lumentum | Technology | Communication Equipment | 256.2x | 1,103.35 | +1.01% | $63.84B | 2026-10-05 to 2026-10-09 | 2026-10-10 |
Lowest P/E Ratios
| Ticker | Company name | Sector | Industry | P/E Ratio | Weekly close | Weekly change | Market cap formatted | Report period | Report date |
|---|---|---|---|---|---|---|---|---|---|
| ALL | Allstate | Financial Services | Insurance - Property & Casualty | 5.5x | 229.43 | +2.37% | $54.30B | 2026-10-05 to 2026-10-09 | 2026-10-10 |
| CMCSA | Comcast | Communication Services | Telecom Services | 5.9x | 20.66 | -4.22% | $115.04B | 2026-10-05 to 2026-10-09 | 2026-10-10 |
| CHTR | Charter Communications | Communication Services | Telecom Services | 6.6x | 103.38 | -5.23% | $30.94B | 2026-10-05 to 2026-10-09 | 2026-10-10 |
| APA | APA Corporation | Energy | Oil & Gas E&P | 6.7x | 45.88 | +5.11% | $9.99B | 2026-10-05 to 2026-10-09 | 2026-10-10 |
| HPQ | HP Inc. | Technology | Computer Hardware | 7.3x | 30.20 | -5.62% | $18.00B | 2026-10-05 to 2026-10-09 | 2026-10-10 |
| PYPL | PayPal | Financial Services | Credit Services | 7.4x | 55.53 | +5.79% | $37.70B | 2026-10-05 to 2026-10-09 | 2026-10-10 |
| MOS | Mosaic Company (The) | Basic Materials | Agricultural Inputs | 7.7x | 18.74 | -10.27% | $9.41B | 2026-10-05 to 2026-10-09 | 2026-10-10 |
| SYF | Synchrony Financial | Financial Services | Credit Services | 7.7x | 72.80 | +1.63% | $25.71B | 2026-10-05 to 2026-10-09 | 2026-10-10 |
| ACGL | Arch Capital Group | Financial Services | Insurance - Diversified | 8.5x | 95.57 | +2.55% | $35.68B | 2026-10-05 to 2026-10-09 | 2026-10-10 |
| SOLV | Solventum | Healthcare | Medical Instruments & Supplies | 8.7x | 87.29 | -0.26% | $13.10B | 2026-10-05 to 2026-10-09 | 2026-10-10 |
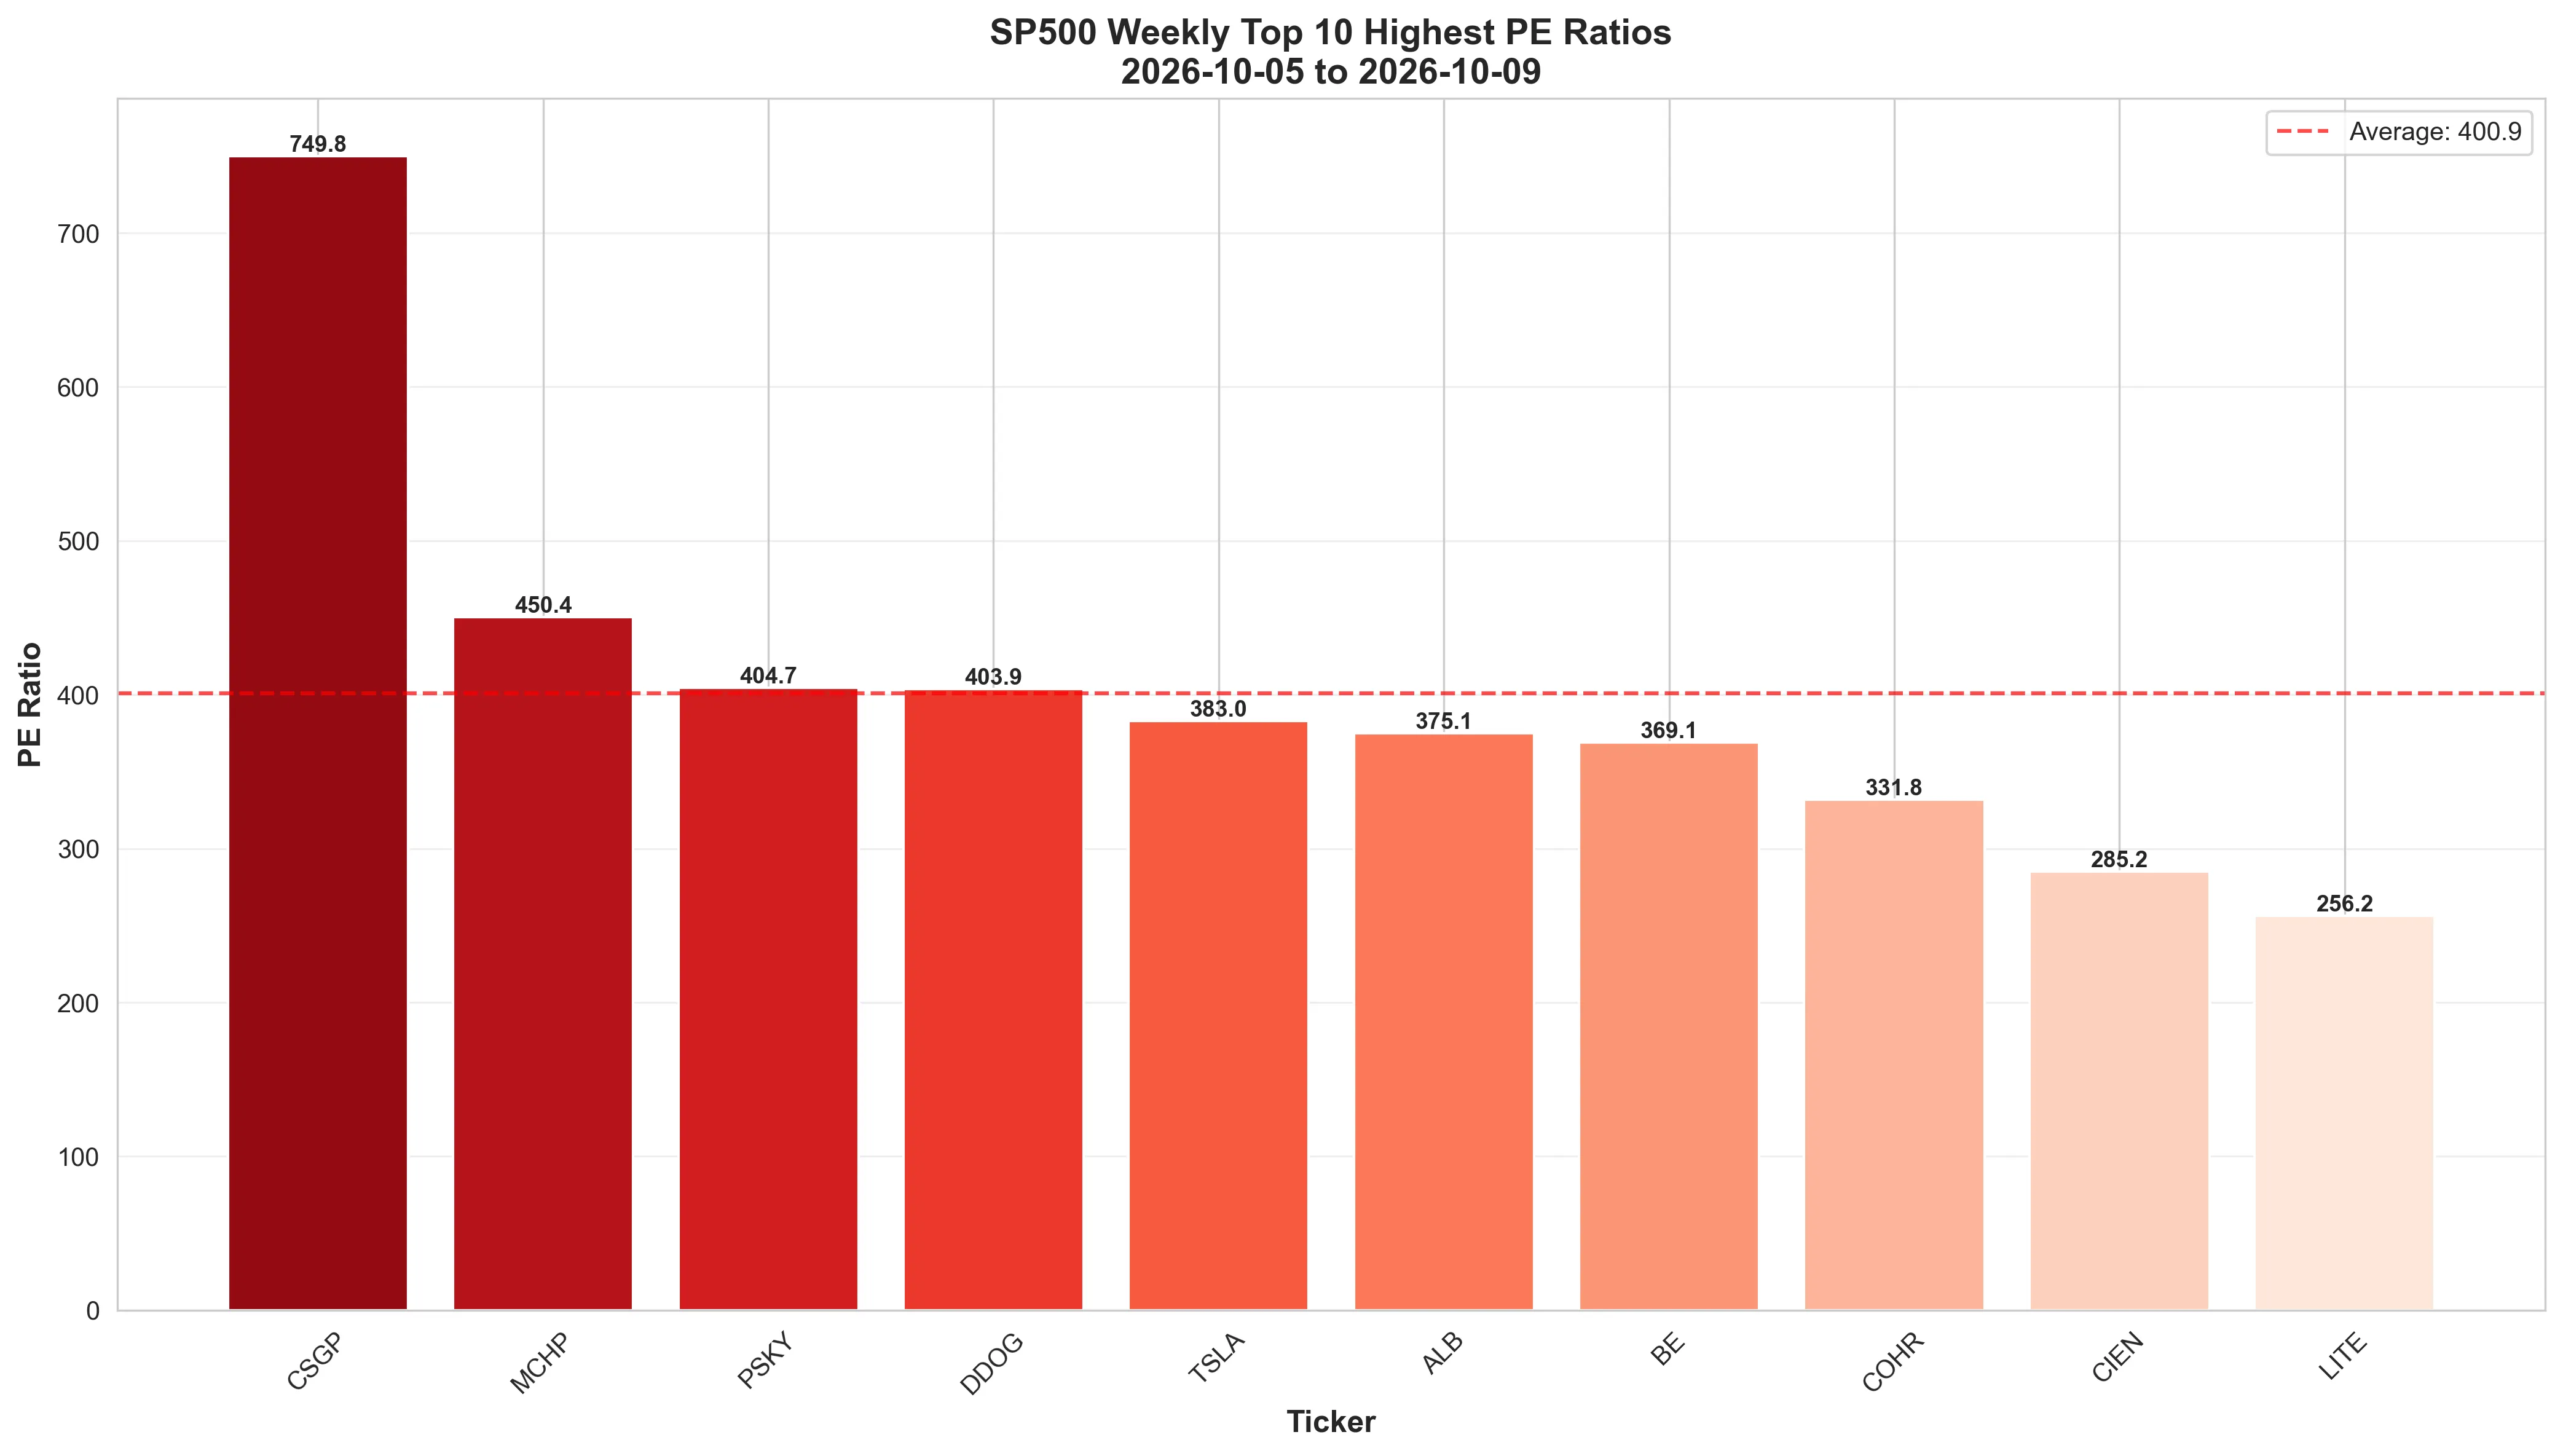
Highest P/E Ratio Visualization
📈 Highest P/E Ratios Visualization
Analysis of growth stocks trading at premium valuations based on earnings multiples
📊 P/E Ratio Analysis • 📅 Generated: October 16, 2026 • 🔄 Updated: 07:00 UTC
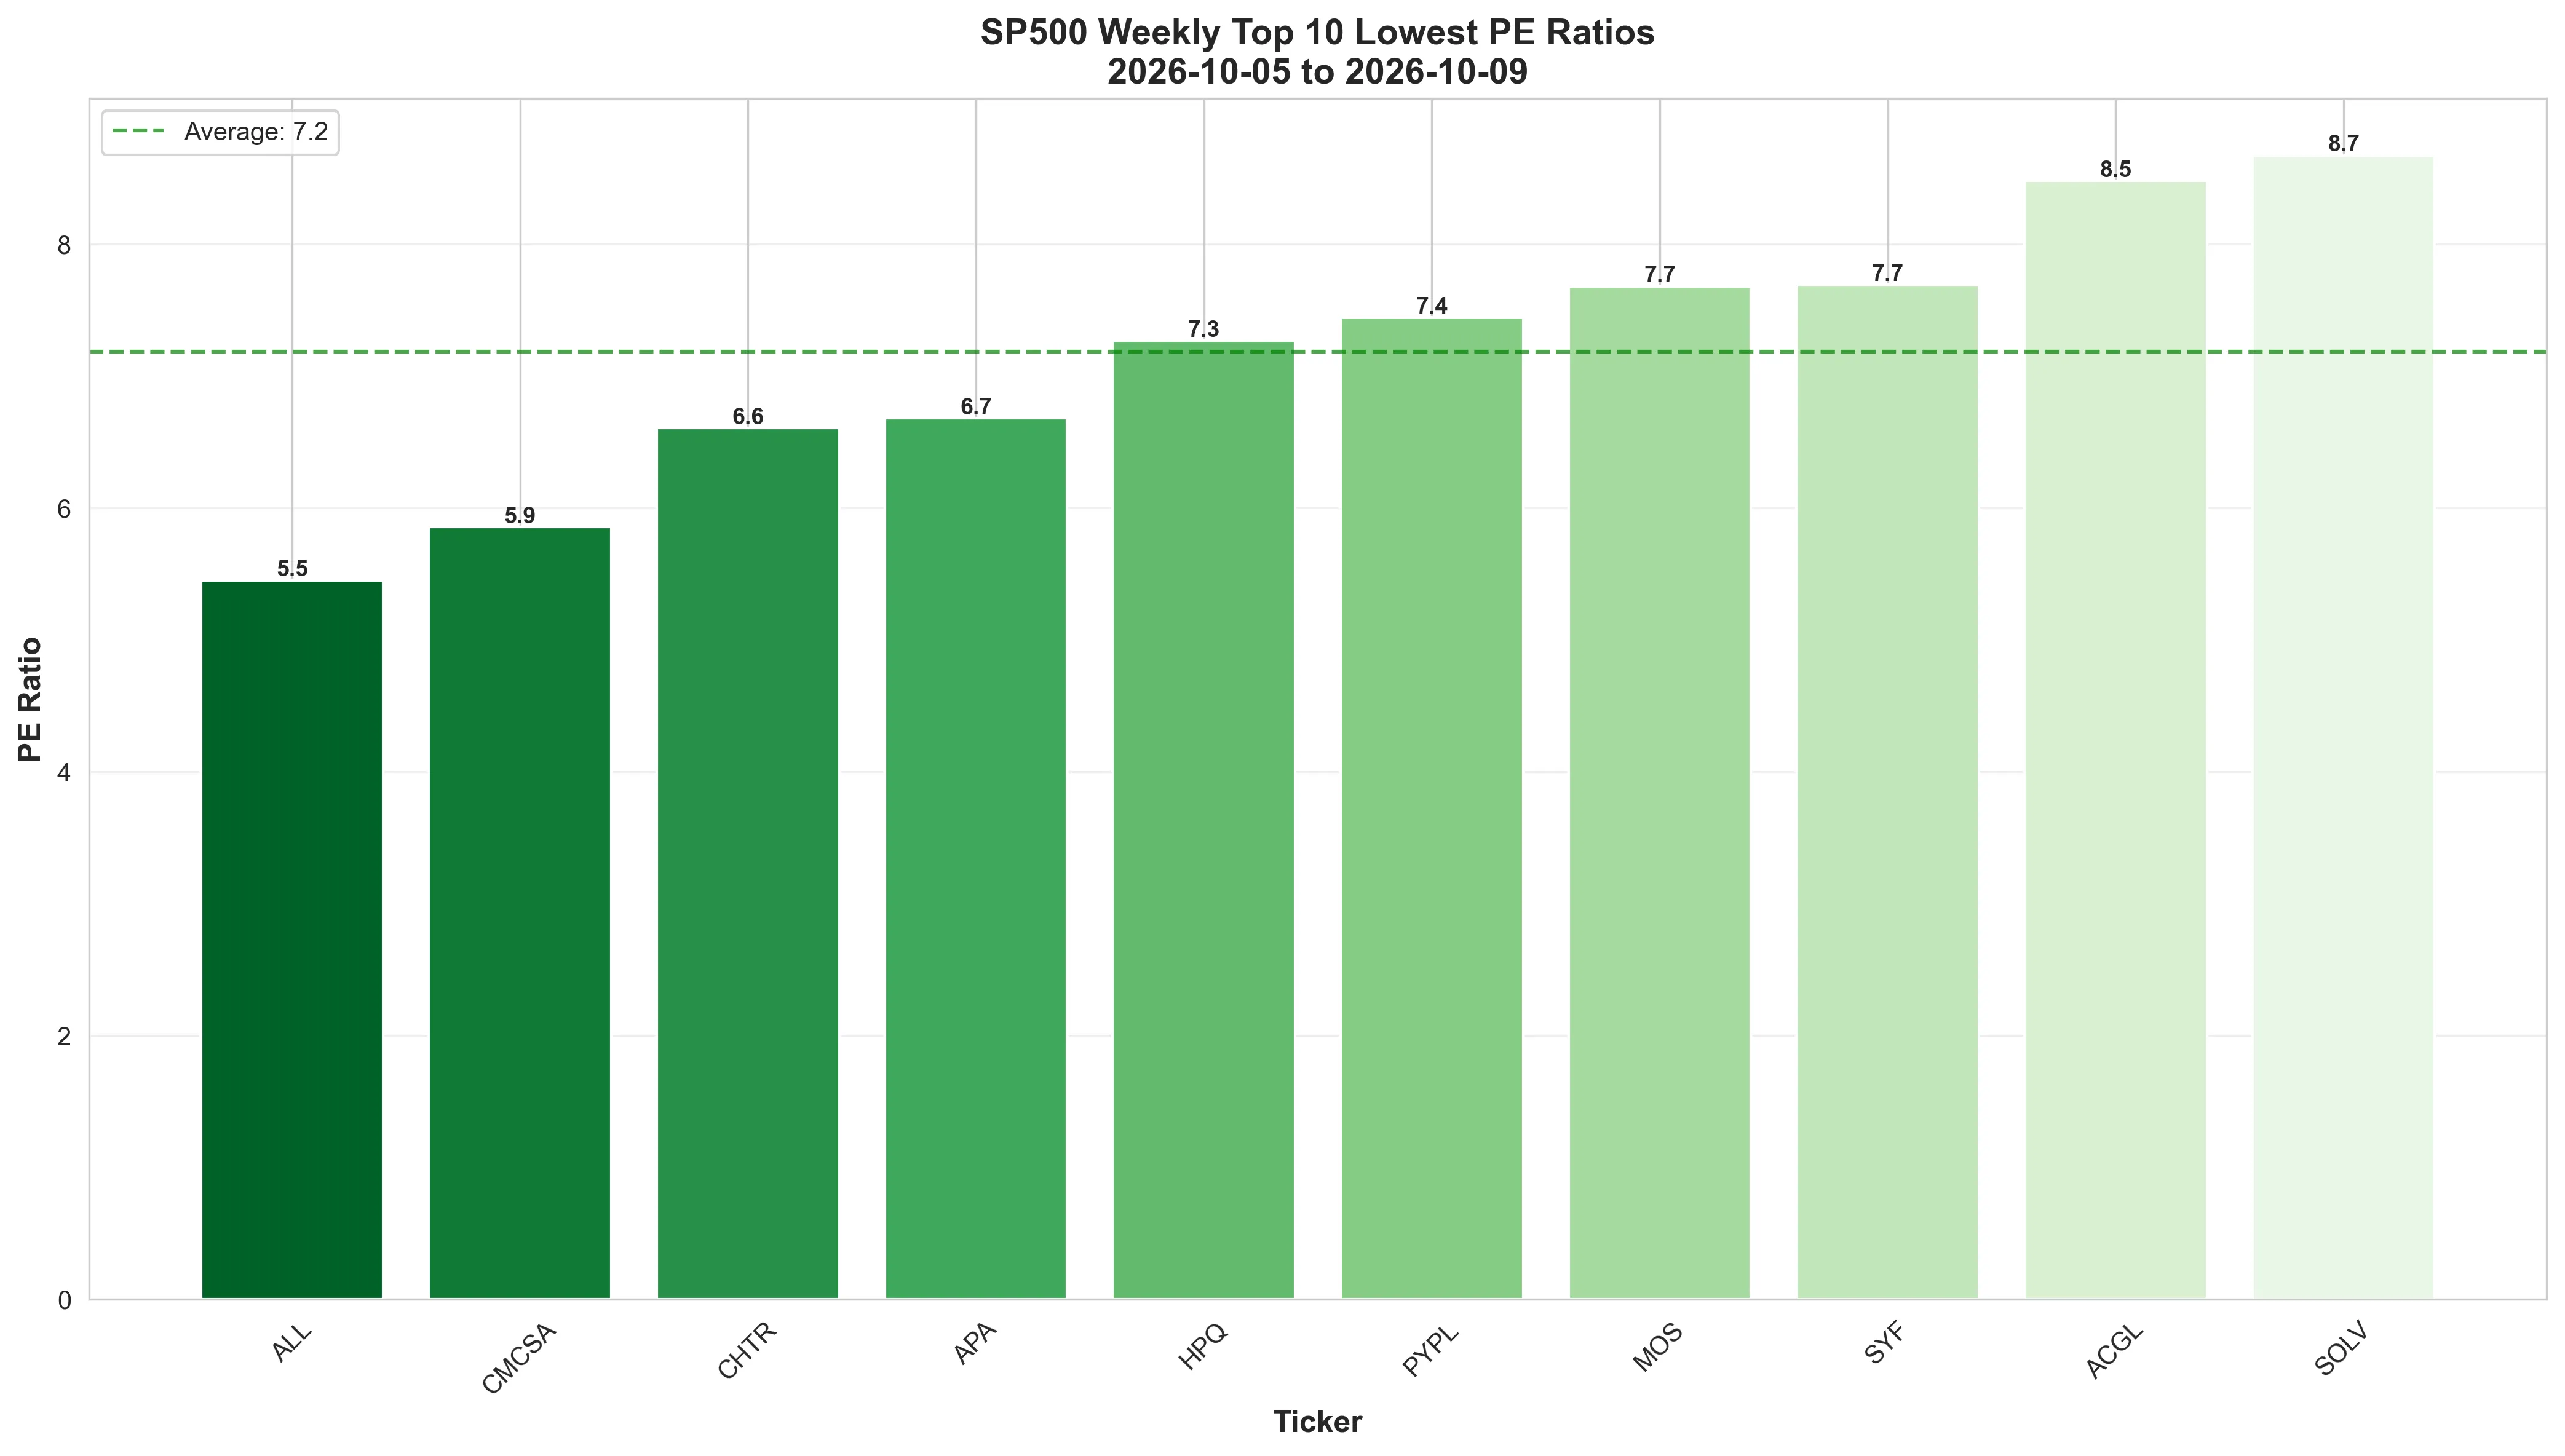
Lowest P/E Ratio Visualization
📉 Lowest P/E Ratios Visualization
Value stocks analysis highlighting companies with conservative earnings multiples
📊 P/E Ratio Analysis • 📅 Generated: October 16, 2026 • 🔄 Updated: 07:00 UTC
⚡ S&P 500 Turnover Leaders
🔥 Market liquidity surged to exceptional levels this week! MU dominated trading activity with $88319.45B in turnover volume, closely followed by MU, NVDA and TSLA as investors repositioned portfolios. The Technology sector commanded attention with 7 of the top 10 positions, highlighting concentrated institutional interest in this market segment. Average turnover across leaders reached approximately $46,798.2 billion, signaling intense capital rotation that often precedes volatility clusters. Elevated turnover provides excellent market liquidity but also suggests potential inflection points as consensus views are tested and repriced in real-time trading.
| Ticker | Company name | Sector | Industry | Weekly turnover | Turnover formatted | Weekly volume | Weekly close | Weekly change | Market cap formatted | Report period | Report date |
|---|---|---|---|---|---|---|---|---|---|---|---|
| MU | Micron Technology | Technology | Semiconductors | $88,319.5B | $88319.45B | 83,782,488,064.00 | 1,029.00 | -3.79% | $463.33B | 2026-10-05 to 2026-10-09 | 2026-10-10 |
| NVDA | Nvidia | Technology | Semiconductors | $84,881.5B | $84881.47B | 359,689,659,648.00 | 229.28 | -2.88% | $4450.88B | 2026-10-05 to 2026-10-09 | 2026-10-10 |
| TSLA | Tesla, Inc. | Consumer Cyclical | Auto Manufacturers | $43,205.8B | $43205.84B | 114,227,623,488.00 | 382.70 | +3.77% | $1566.42B | 2026-10-05 to 2026-10-09 | 2026-10-10 |
| AMD | Advanced Micro Devices | Technology | Semiconductors | $41,577.2B | $41577.16B | 65,704,150,336.00 | 608.10 | -3.53% | $338.02B | 2026-10-05 to 2026-10-09 | 2026-10-10 |
| AAPL | Apple Inc. | Technology | Consumer Electronics | $40,251.4B | $40251.42B | 119,982,484,160.00 | 336.64 | +1.16% | $3759.44B | 2026-10-05 to 2026-10-09 | 2026-10-10 |
| MSFT | Microsoft | Technology | Software - Infrastructure | $37,555.8B | $37555.79B | 71,042,186,688.00 | 535.07 | +2.54% | $2982.76B | 2026-10-05 to 2026-10-09 | 2026-10-10 |
| INTC | Intel | Technology | Semiconductors | $35,941.6B | $35941.58B | 322,496,407,552.00 | 104.70 | -9.41% | $233.72B | 2026-10-05 to 2026-10-09 | 2026-10-10 |
| META | Meta Platforms | Communication Services | Internet Content & Information | $35,182.5B | $35182.52B | 48,258,622,720.00 | 718.67 | -1.19% | $1618.33B | 2026-10-05 to 2026-10-09 | 2026-10-10 |
| AMZN | Amazon | Consumer Cyclical | Internet Retail | $31,973.9B | $31973.94B | 124,870,548,352.00 | 262.43 | +4.90% | $2133.99B | 2026-10-05 to 2026-10-09 | 2026-10-10 |
| AVGO | Broadcom | Technology | Semiconductors | $29,093.2B | $29093.16B | 79,197,832,384.00 | 361.54 | +1.05% | $1541.72B | 2026-10-05 to 2026-10-09 | 2026-10-10 |
⚡ S&P 500 Turnover Leaders Chart
Analysis of stocks with the highest trading volume and turnover rates
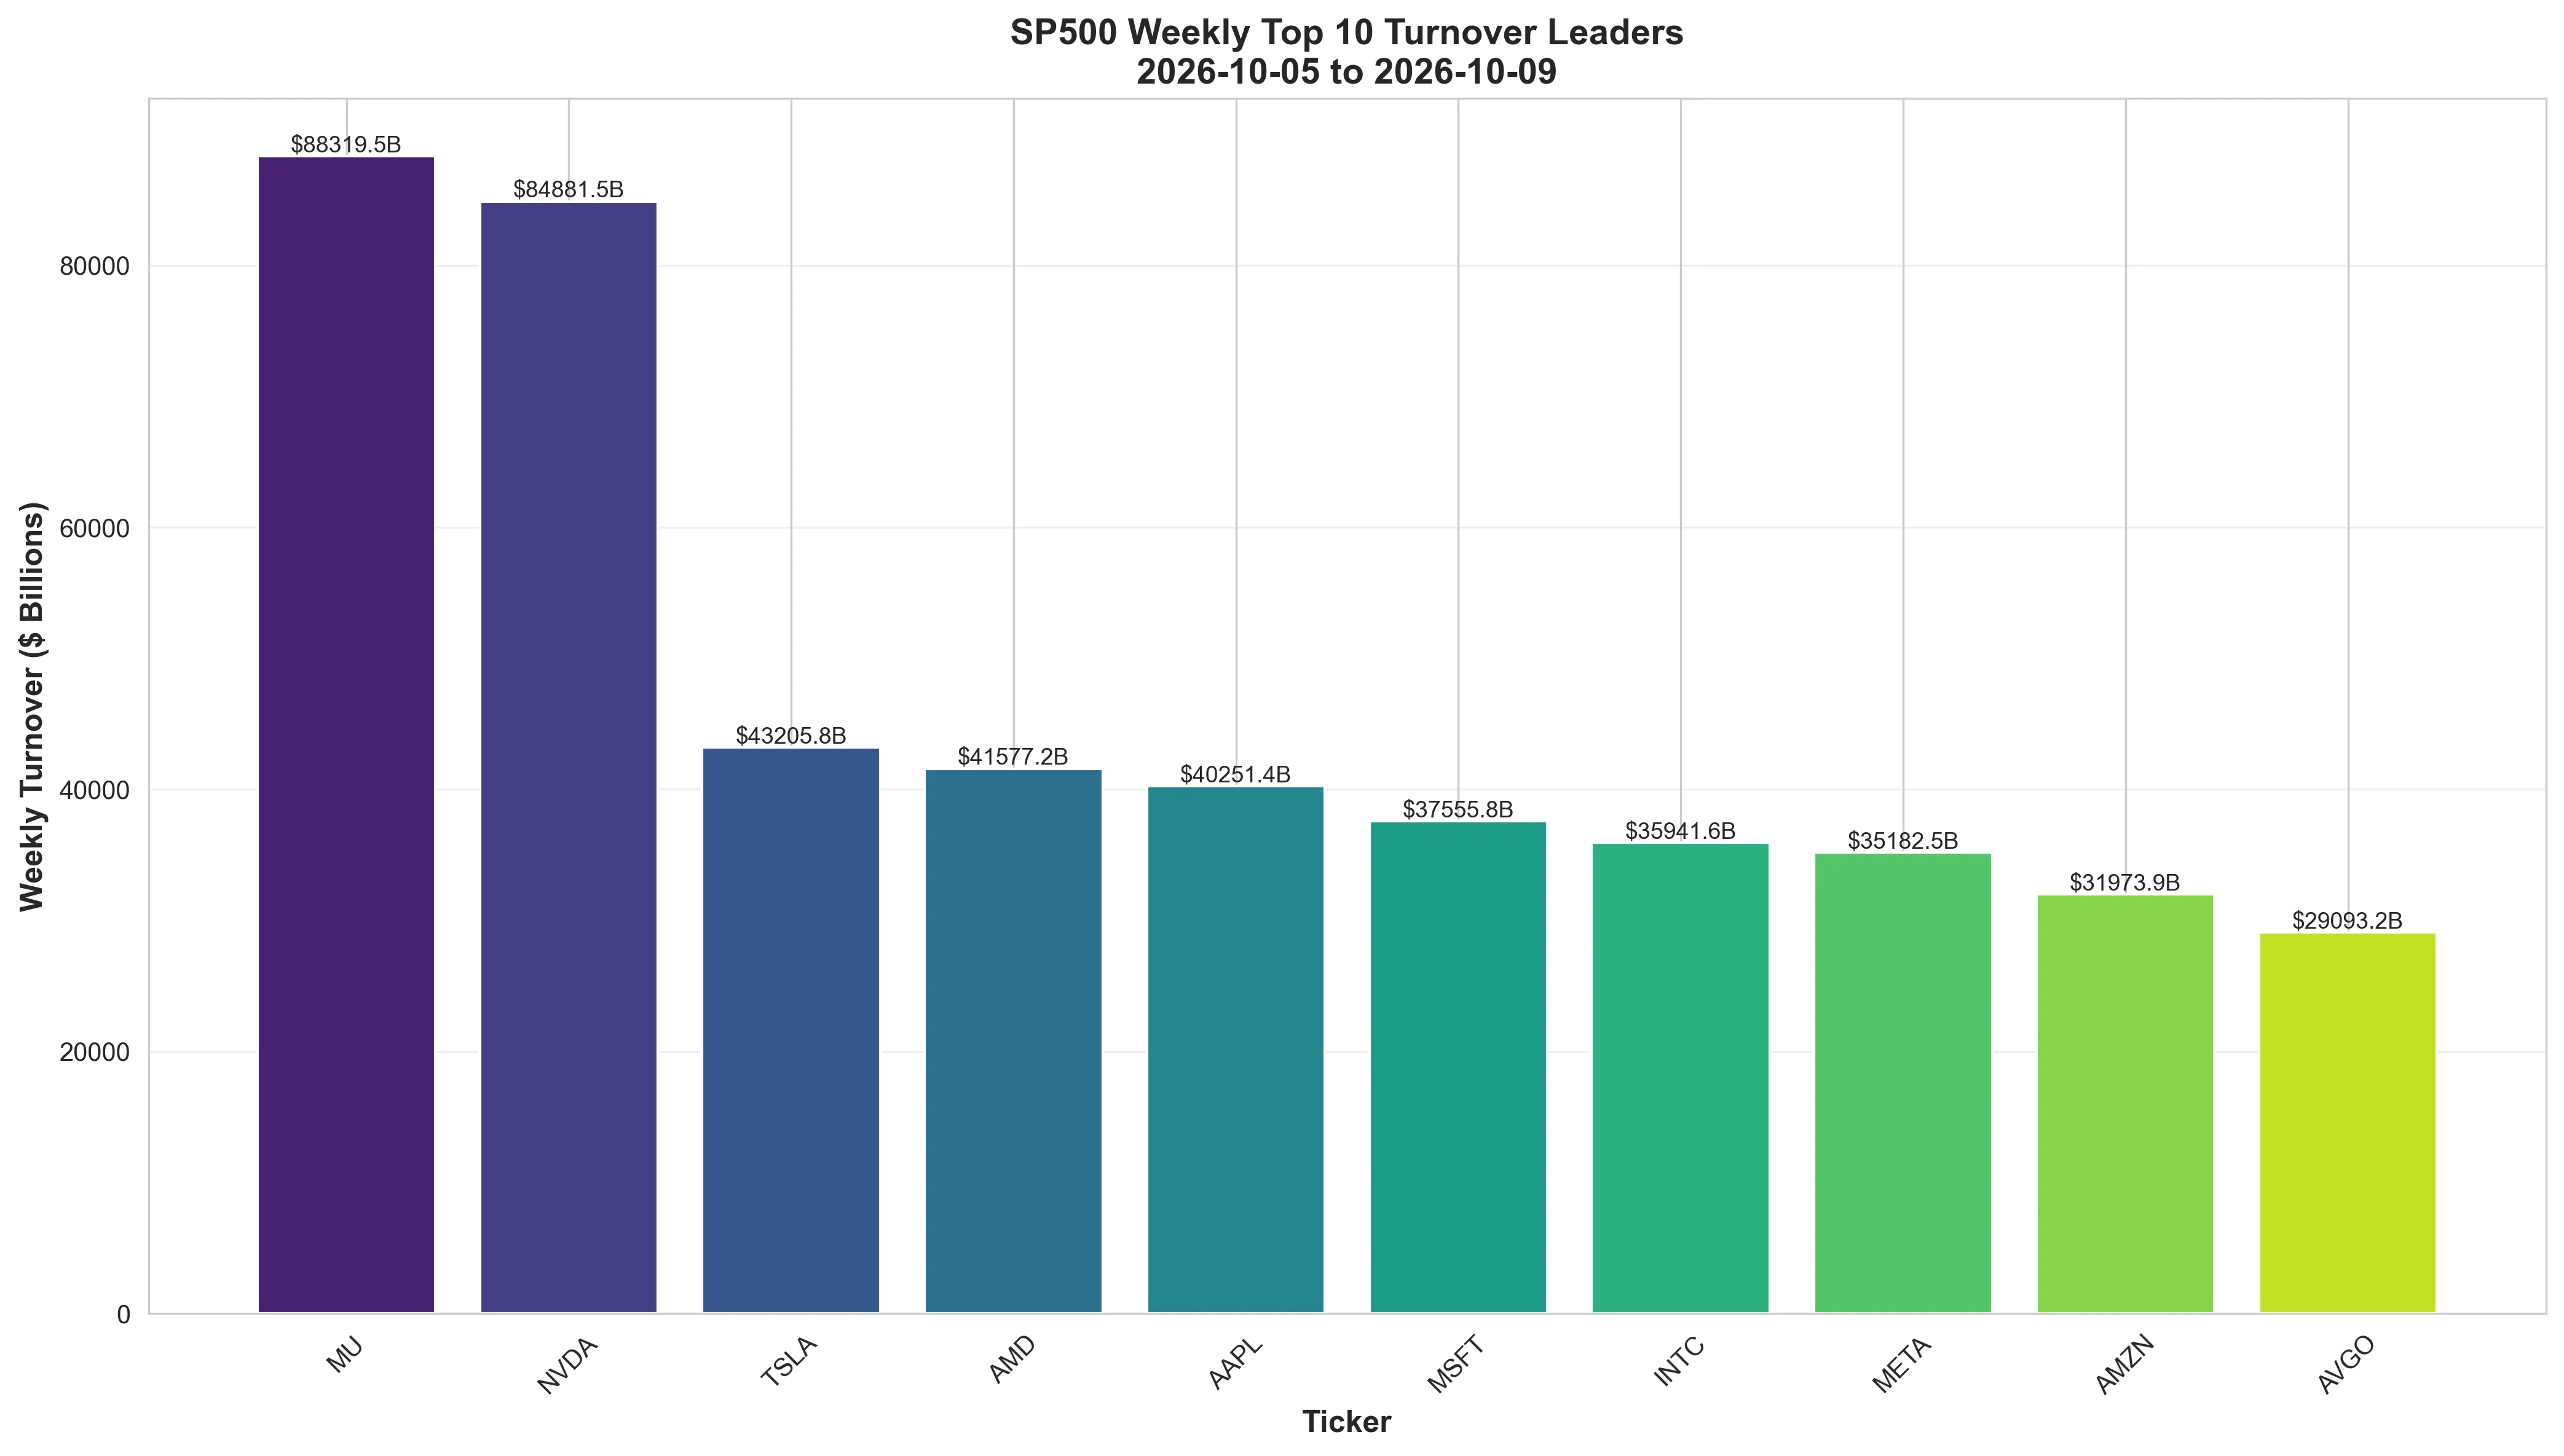
📈 Data Source: S&P 500 Market Data • 📅 Generated: October 16, 2026 • 🔄 Updated: 07:00 UTC
📋 Weekly Market Summary & Investor Takeaways (2026-10-05 - 2026-10-09)
📊 Weekly Performance Snapshot
- S&P 500 Weekly Return: +1.15%
- S&P 500 Opening: 7,722.72
- S&P 500 Closing: 7,811.54
- Top Gainer: CCI (+17.85%)
- Top Loser: MOS (-11.98%)
- Best Sector: Utilities (+3.4284%)
- Worst Sector: Communication Services (-1.1748%)
- Highest Sector P/E: Communication Services (181.2x)
- Lowest Sector P/E: Financials (20.6x)
- Avg Sector P/E: 49.4x
- Sector P/E Spread: 160.6x
- Top Turnover: MU ($88319.45B)
- Combined Turnover (Top 10): $468.0T
- Highest Stock P/E: CSGP (749.8x)
- Lowest Stock P/E: ALL (5.5x)
🎯 Key Market Observations
Moderate Movement: The market exhibited measured directional moves. Extreme Sector Valuation Range: Significant P/E divergence between Communication Services (181.2x) and Financials (20.6x) highlights stark growth vs value dichotomy. More sectors (8 of 11) trade below average P/E, indicating value-oriented market positioning. Sector Strength: The Real Estate sector showed relative strength with 3 representatives among top performers. Turnover Concentration: MU led with $88319.45B in trading volume, with the Technology sector accounting for 7 of the top 10 most-traded names. Individual Stock Valuation Divergence: Extreme P/E spread (744.3812x) between CSGP (749.8334x) and ALL (5.4522x) highlights market segmentation between growth and value investors.
💡 Investor Takeaways & Strategic Insights
- Selective Allocation: In consolidating markets, focus on sector rotation opportunities. Consider trimming extended positions and adding to laggards showing signs of technical improvement.
- Sector Valuation Strategy: Blend exposure to high-growth sectors like Communication Services (181.2x P/E) with value-oriented sectors like Financials (20.6x P/E) to balance growth potential with margin of safety. Monitor sector rotation signals for optimal entry/exit timing.
- Liquidity Management: High turnover stocks like those trading over $88319.45B offer excellent liquidity for large positions but can also signal potential volatility inflection points. Use elevated volume as both an entry/exit indicator and a volatility warning signal.
- Individual Stock Valuation Balance: Consider blending growth exposure (like high-PE CSGP at 749.8334x) with value opportunities (like ALL at 5.4522x) to balance portfolio risk. High P/E stocks require strong growth validation while low P/E stocks may offer margin of safety but need catalyst analysis.
- Sector Rotation Strategy: The strength in Utilities indicates where institutional capital is flowing. Consider overweighting this sector while monitoring for signs of exhaustion or rotation into lagging sectors showing early technical improvement.
- Risk Framework: Implement disciplined position sizing (1-3% per position), use stop-losses based on technical levels, and maintain portfolio diversification across sectors and market caps. Rebalance quarterly to maintain target allocations.
- Strategic Patience: Avoid chasing extreme moves. For high-turnover, high-P/E stocks, wait for pullbacks to key support levels. For value opportunities with low P/E ratios, accumulate gradually and be prepared for potential value traps by focusing on improving fundamentals.
- Sector vs Stock Analysis: Compare sector-level valuations with individual stock P/E ratios. A stock trading at a premium to its sector average may indicate company-specific growth prospects, while a discount could signal potential value or fundamental concerns requiring deeper analysis.
Disclaimer: This analysis is for informational purposes only. Past performance does not guarantee future results. The content should not be construed as investment advice. Always conduct your own research and consult with qualified financial advisors before making investment decisions. Market conditions can change rapidly, and individual results may vary.
📊 Federal Reserve Economic Indicators
Key macroeconomic indicators tracked by the Federal Reserve, updated weekly for market analysis and economic outlook assessment.
Federal Funds Rate
Consumer Price Index (CPI)
Core CPI (less food & energy)
Unemployment Rate
Real Gross Domestic Product
10-Year Treasury Yield
Producer Price Index (PPI)
Source: Federal Reserve Economic Data (FRED). Data frequency varies by indicator (Daily, Monthly, Quarterly). Latest available data shown.
⚠️ Important Disclaimer
Risk Warning: All investment analysis, market commentary, and trading ideas provided on this website are for educational and informational purposes only. They do not constitute financial advice, investment recommendations, or solicitations to buy or sell any securities.
Stock market investments are subject to market risks. Past performance does not guarantee future results. You should consult with qualified financial advisors and conduct your own research before making any investment decisions. The authors and website owners are not responsible for any financial losses resulting from actions taken based on the information provided.
Source: S&P 500 Weekly Data | Compiled by-Md Kollol Hossain, CEO, CapitalinsightBD
NASDAQ 100 Weekly Market Pulse
SP500 Stocks’ Performance Analysis Dashboard
SP 500 Market Analysis Dashboard
S&P 500 Index Performance and Earnings Anatomy (2020–2025)
Important Links to Navigate
This analysis is for educational purposes only and does not constitute financial or investment advice.
Thanks once again