US Stock Market Shocks Insights provides a data-driven framework to understand how individual stocks react during periods of market stress, volatility, and index-level movements. Designed for investors, traders, and portfolio managers, this analysis goes beyond traditional risk metrics by examining negative trading days, drawdowns, and shock behavior of S&P 500 stocks relative to the broader market. By leveraging historical price data and comparative analysis against the S&P 500 index, this tool helps investors identify hidden risk patterns, diversification opportunities, and stocks that behave differently during market uptrends and downturns—crucial for building resilient portfolios in an increasingly volatile US equity market.
A Powerful Tool for Investors
Investing in the US stock market requires not only intuition but also robust, data-driven insights. While traditional methods like mean-variance analysis and standard deviation are widely used to evaluate stock volatility and construct diversified portfolios, there’s a growing need for supplementary tools that provide a deeper perspective on risk and market behavior.
At Capital Insight BD, we’ve developed a unique approach to help investors understand market shocks and their impact on individual stocks relative to the S&P 500 index. Our platform organizes and summarizes data for every S&P 500 stock, offering insights that are crucial for constructing a risk-resilient portfolio.
Comprehensive Market Shock Summary
Our “Market Shocks Summary – All Ticker US” module (view here) provides a ready-to-use, cleaned dataset detailing stock performance from your chosen date range. The summary includes:
- Total Trading Days: Understand the overall market activity for each stock.
- Total Negative Trading Days of Ticker & SP500 Index: Identify how often a stock declined compared to the market.
- Negative Trading Days of Ticker When SP500 Upward/Downward: Pinpoint periods when stocks performed differently than the broader market.
- Maximum Negative Shock & Corresponding Date: Discover extreme drawdowns to gauge risk exposure.
- Detailed Breakdown of Shocks Relative to SP500 Movements: Helps identify stock behavior in market uptrends and downtrends.
This interactive module allows users to rank stocks dynamically by clicking on column headers. For example, if an investor wants to see which stocks fell the most when the S&P 500 was rising, it can be done instantly—making it a practical tool for risk assessment and decision-making.
Live Stock Market Shock Analysis
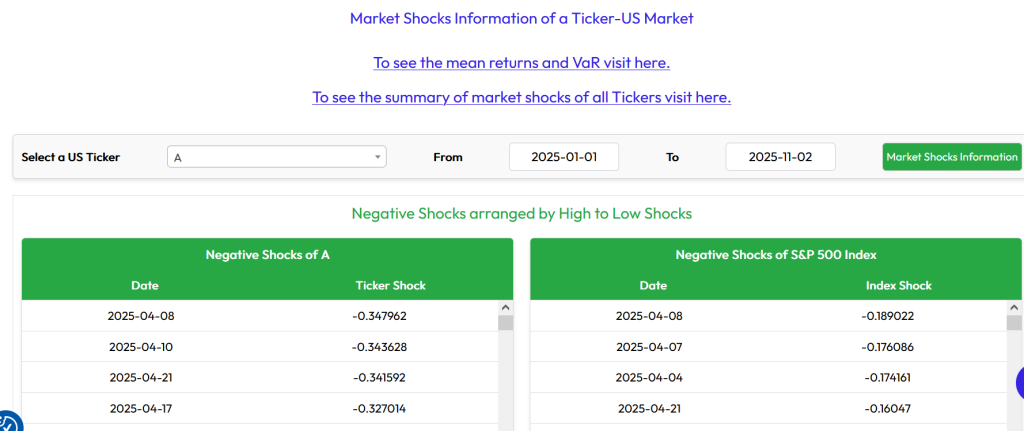
For those who want a more granular, real-time approach, we also provide the “Market Shocks Information – US” module (view here). This tool lets users select any ticker and date range to calculate live market shocks and understand stock movements in real-time.
Key features of this module include:
Actionable insights: Helps investors identify unusual movements, potential risk exposure, and opportunities for portfolio adjustments.
User-defined ticker & date selection: Analyze stock behavior exactly when it matters.
Real-time calculations: Instantly see negative trading days, maximum draw-downs, and comparative performance with the S&P 500.
Below is the screen shot of this live interactive Market Shock Module
Why Market Shock Analysis Matters
While volatility metrics provide a snapshot of potential risk, market shock analysis goes a step further by showing how individual stocks react during significant market movements. By integrating this data with traditional portfolio construction techniques, investors can:
- Build risk-resilient portfolios that withstand market turbulence.
- Identify stocks that tend to move independently of the broader index, providing diversification benefits.
- Make informed decisions based on historical negative shocks and market behavior patterns.
Conclusion
At Capital Insight BD, our mission is to empower investors with data-driven insights that simplify complex market behavior. Whether you are evaluating the entire S&P 500 or analyzing a single stock in real-time, our market shock modules offer the clarity needed to navigate today’s volatile market environment.
Written By-Md Kollol Hossain, CEO, CapitalinsightBD
Explore the tools now and gain a competitive edge in understanding US stock market dynamics:
Invest smarter. Measure risk. Understand market shocks.
This article is for educational purposes only and does not constitute financial or investment advice.