

-A Practical Guide for Smarter Business Decisions
Understanding the break-even point and cost behavior is essential for making smarter, data-driven business decisions in today’s competitive environment. Break-even analysis—also known as Cost Volume Profit (CVP) analysis—helps managers, entrepreneurs, and business owners determine the minimum sales volume required to cover fixed and variable costs, assess profitability, control expenses, set optimal pricing, and evaluate new projects with confidence. By explaining break-even formulas in units and sales revenue, real-world business examples, contribution margin concepts, and the practical relationship between fixed costs and variable costs, this guide provides a clear and practical framework for managerial accounting, financial planning, risk assessment, and strategic decision-making. When combined with a solid understanding of cost behavior, break-even analysis becomes a powerful financial tool for improving profit planning, cost control, and long-term business sustainability.
Every business—small or large—runs on decisions. Whether it’s setting the right price, planning production, or evaluating a new project, managers constantly face choices that impact profit. To make those decisions confidently, they rely on powerful financial tools. Among these, Break-Even Analysis and Cost Behavior Analysis remain two of the most practical and widely used techniques in managerial accounting.
What Is the Break-Even Point?
The Break-Even Point (BEP) is the stage where a business makes no profit and no loss. At this level, total revenue equals total cost.
It answers a key question every business must ask:
“How much do I need to sell to cover all my costs?”
Knowing the break-even point gives managers a minimum target to remain financially safe. Anything sold beyond this point becomes profit.
Why Break-Even Analysis Matters for Decision Making
Break-even analysis is much more than just a mathematical formula—it acts like a financial compass for managers. Here’s how:
1. Helps Set the Right Price
Managers can see how different prices affect profitability and find the ideal price point without hurting demand.
2. Supports Cost-Control Efforts
A high break-even point may signal rising costs. This gives management a chance to adjust production processes or negotiate supplier rates.
3. Evaluates New Projects
Before launching a product or service, companies calculate the break-even point to estimate whether the idea is financially feasible.
4. Measures Risk
Industries with uncertain demand—like retail or manufacturing—depend heavily on break-even analysis to foresee revenues under different sales volumes.
5. Guides Strategic Planning
Whether it’s expansion, automation, or adding new equipment, break-even figures help in making informed long-term decisions.
Break Even Point Calculator
A Simple Story: How a Business Owner Uses Break-Even Analysis
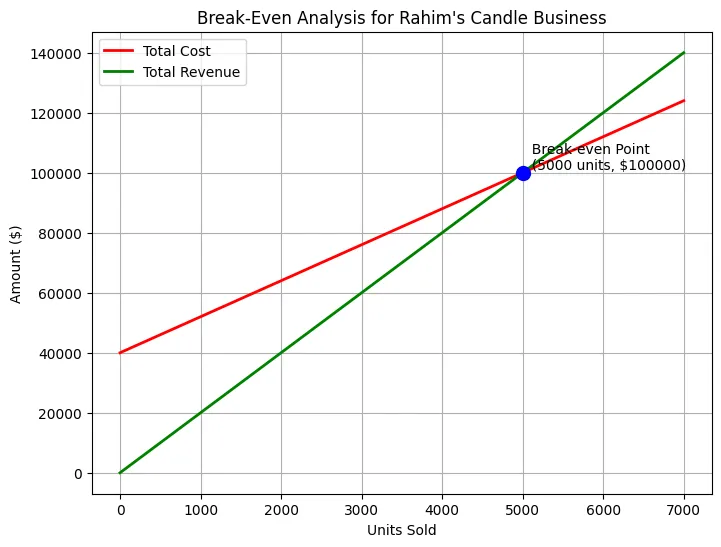
Imagine a small entrepreneur, Rahim, who plans to start selling premium handmade candles. He wants to know how many candles he must sell to avoid loss. He pays fixed amount of rent, rates and taxes monthly basis.
- Selling Price per candle (SP): $20
- Variable Cost per candle (VC): $12
- Monthly Fixed Costs: $40,000
Rahim first calculates the contribution margin: Contribution per Unit=20−12=8
Break-even units:
40,000÷8=5,000 units
This means Rahim must sell 5,000 candles per month to cover all costs.
Break-even revenue:
Contribution Margin Ratio: 8/20=0.40
Break-Even Revenue=40,0000/0.40=100,000
Rahim now knows he needs $100,000 in monthly sales just to break even.
Anything above this turns into profit.
This simple calculation gives him clarity and confidence, helping him decide whether to proceed, adjust price, or reduce costs. This is exactly why break-even analysis is such a valuable managerial tool.
Understanding Cost Behavior: Variable vs Fixed Costs
Cost behavior refers to how costs change (or don’t change) when production levels shift.
A common misconception is:
“Variable cost varies per unit and fixed cost is constant per unit.”
This is incorrect. Here’s the real picture:
✔ Variable Costs – Constant Per Unit, Change in Total
Variable cost per unit is usually constant, but total variable cost changes with production volume.
Example:
Material cost of $5 per unit →
- 1 unit = $5
- 100 units = $500
- 1,000 units = $5,000
So variable cost is named for how the total cost varies, not the unit cost.
✔ Fixed Costs – Constant in Total, Change Per Unit
Fixed costs (rent, salaries, insurance) stay the same in total, even if production changes.
But fixed cost per unit decreases as more units are produced.
Example:
Fixed monthly rent = $10,000
- Produce 100 units → $100 per unit
- Produce 1,000 units → $10 per unit
- Produce 10,000 units → $1 per unit
Thus, fixed cost per unit is not constant.
Why Understanding Cost Behavior Is Crucial
Knowing which costs change and which remain stable helps managers:
- Prepare flexible budgets
- Estimate profits accurately
- Set competitive pricing
- Plan capacity and resources
- Avoid misinterpretation of financial statements
Together, break-even analysis and cost behavior insights form a strong foundation for managerial decision making.
Final Thoughts
Break-even analysis provides a clear financial picture of how sales, costs, and profits interact. When combined with a solid understanding of cost behavior, managers can make smarter, data-driven decisions that reduce risk and increase profitability.
In a world where competition grows every day, these tools act as a guiding light for business owners looking to maintain stability and achieve sustainable growth.
Written by Md Kollol Hossain, CEO, CapitalinsightBD — empowering professionals with clarity in finance, analytics, and business strategy.
This article is for educational purposes only and does not constitute financial or investment advice.
IBB Banking Professional Exam -2024 AIBB Management Accounting-Question-2
a) Define break-even point. How does break-even analysis help credit officer in taking lending decision?
b) A company manufactured and sells a single product which has the following cost and selling price structure.
| Tk/Unit | Tk/Unit | |
|---|---|---|
| Selling price | 120 | |
| Direct material | 22 | |
| Direct labor | 36 | |
| Variable overhead | 14 | |
| Fixed overhead | 12 | |
| Profit per unit | 84 | |
| 36 |
The fixed overhead absorption rate is based on the normal capacity of 2,000 units per month. Assume that the same amount is spent each month, on fixed overhead. Budgeted sales for the next month are 2,200 units.
You are required to calculate:
(i) the break-even point, in sales units per month;
(ii) the margin of safety for next month;
(iii) the budgeted profit for next month;
(iv) the sales required to achieve a profit of Tk. 96,000 in a month;
(v) the break-even revenue that must be generated in order to break-even.
Solution to Question No. 2 (a)
The Break-Even Point (BEP) is the level of sales volume (in units or sales revenue) where total revenue equals total costs (both fixed and variable). At this point, the business makes neither profit nor incurs loss.
How Break-Even Analysis Helps a Credit Officer in Lending Decisions
Break-even analysis is a key financial tool used by credit officers to evaluate the risk of default and assess a borrower’s debt-paying ability:
- Assessing Viability & Margin of Safety: It indicates how far sales can fall before the borrower incurs operational losses, helping assess the borrower’s cushion against market downswings.
- Evaluating Operational Risk: A high break-even point means high operating leverage (high fixed costs), which increases default risk if revenue drops.
- Debt Servicing Capability: Credit officers can incorporate financial fixed charges (interest and loan repayments) into the break-even model to determine the minimum sales volume needed to service debt obligations comfortably.
- Sensitivity & Scenario Analysis: It allows officers to stress-test borrower projections against price reductions or cost inflation to see if the firm remains solvent.
Solution to Question 2 (b)
Preliminary Cost & Price Analysis
| Cost Component | Amount (Tk. per Unit) |
|---|---|
| Selling Price (SP) | 120.00 |
| Direct Material | 22.00 |
| Direct Labor | 36.00 |
| Variable Overhead | 14.00 |
| Total Variable Cost per Unit (VC) | 72.00 |
• Contribution Margin per Unit (CM) = Selling Price − Variable Cost = Tk. 120 − Tk. 72 = Tk. 48
• Profit-Volume (P/V) Ratio = (CM ÷ Selling Price) × 100 = (48 ÷ 120) × 100 = 40%
• Total Monthly Fixed Overhead = Normal Capacity × Fixed Overhead Rate = 2,000 units × Tk. 12 = Tk. 24,000
(i) Break-Even Point in Sales Units per Month
(ii) Margin of Safety for Next Month
Budgeted Sales = 2,200 units
- In Units: Budgeted Sales − BEP Sales = 2,200 − 500 = 1,700 units
- In Value (Tk.): 1,700 units × Tk. 120 = Tk. 204,000
- In Percentage: (1,700 ÷ 2,200) × 100 = 77.27%
(iii) Budgeted Profit for Next Month
Budgeted Profit = (Budgeted Units × CM per Unit) − Total Fixed Overhead
Budgeted Profit = (2,200 × Tk. 48) − Tk. 24,000
Budgeted Profit = Tk. 105,600 − Tk. 24,000 = Tk. 81,600
(Alternative method: Margin of Safety Units × CM per Unit = 1,700 × Tk. 48 = Tk. 81,600)
(iv) Sales Required to Achieve a Profit of Tk. 96,000 in a Month
Calculation (Units): (24,000 + 96,000) ÷ 48 = 120,000 ÷ 48 = 2,500 units
Calculation (Revenue): 2,500 units × Tk. 120 = Tk. 300,000
(v) Break-Even Revenue
Break-Even Revenue = BEP (Units) × Selling Price
Break-Even Revenue = 500 units × Tk. 120 = Tk. 60,000
(Alternative using P/V Ratio: Total Fixed Cost ÷ P/V Ratio = 24,000 ÷ 0.40 = Tk. 60,000)